Backtrace Blog
For the latest developments from our engineering team, head over to the Engineering Blog at engineering.backtrace.io.
Backtrace Improvements and New Features in 2023: Backtrace Dashboard Upgrades
Backtrace has recently rolled out several exciting new improvements that have made it easier than ever to filter results, save views, and navigate through the triage view. In this blog, we will review the new features in detail.
Rapid Issue Filtering: Instant Access to Error Type and Platform Selection for Efficient Triage
The first change you will notice is a filter that allows you to select the 'error type.' This feature enables you to filter results by error type. You can now easily view all errors that resulted from a crash, hang, unhandled exception, exception, or low memory. This dropdown is available under Overview, Releases, Triage and Explore view tabs.
The second addition is the ability to filter by 'platform.' This feature allows you to filter results to see data for all exceptions that occurred only on a specific platform such as PS5 or IOS. This dropdown is available under Overview and Explore tabs.
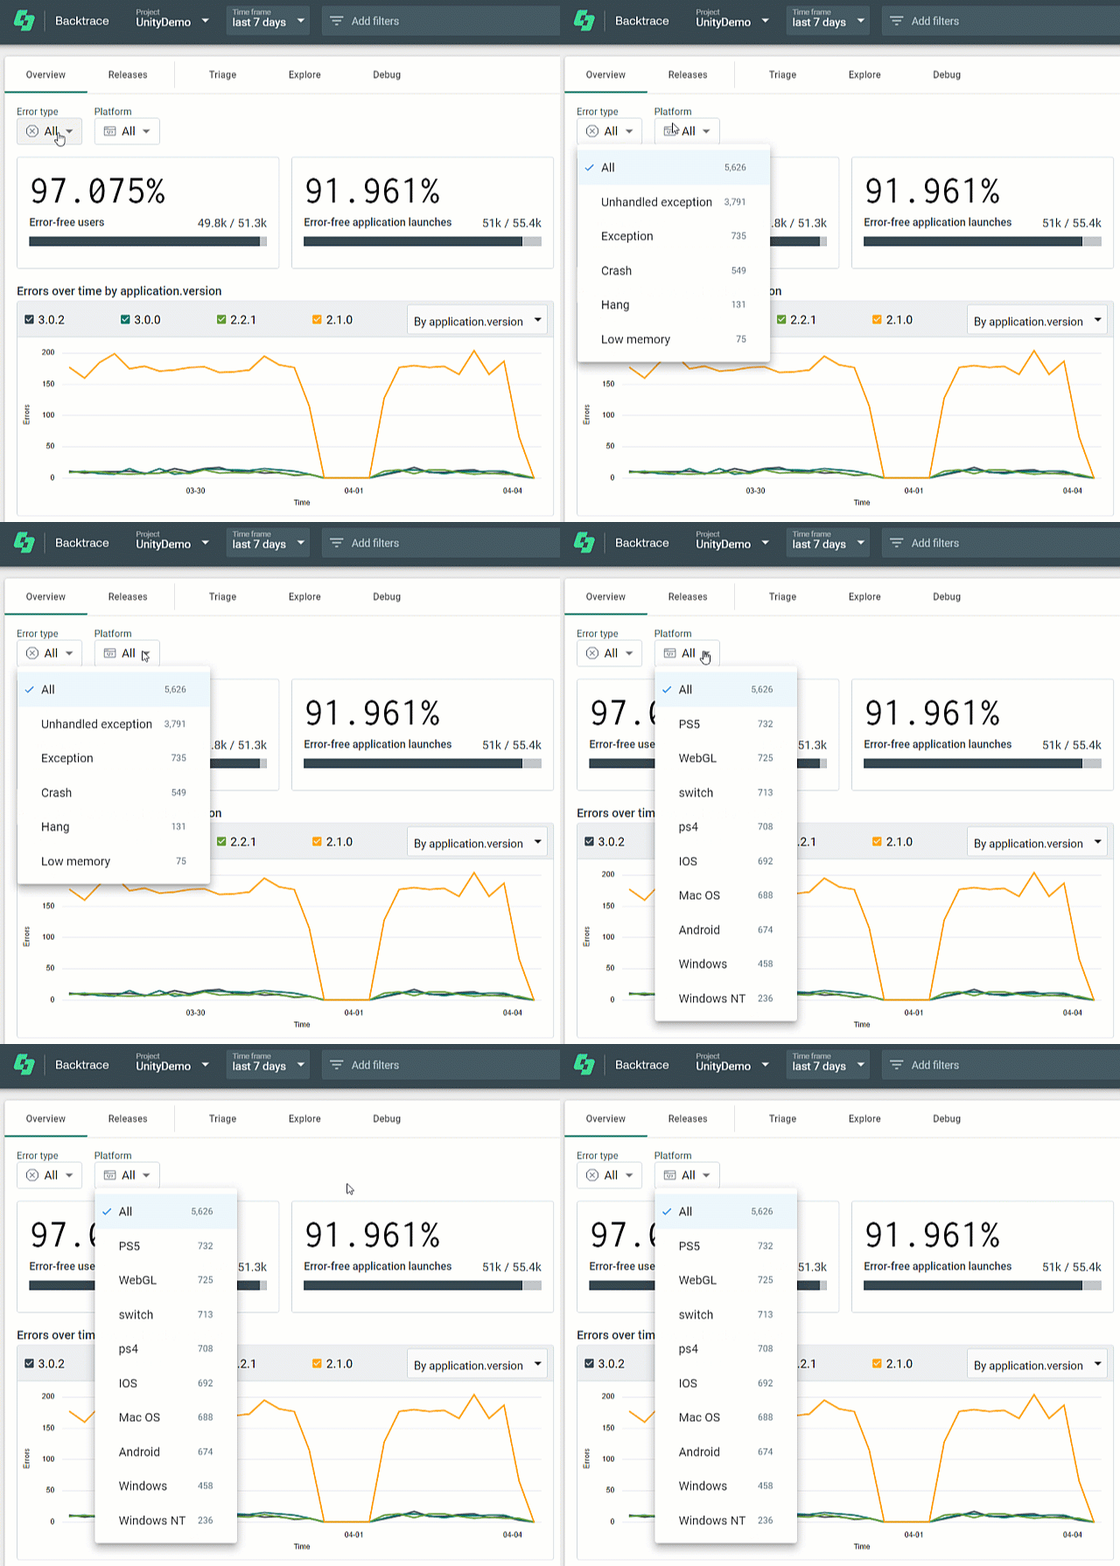
Filter-dropdowns in Releases tab
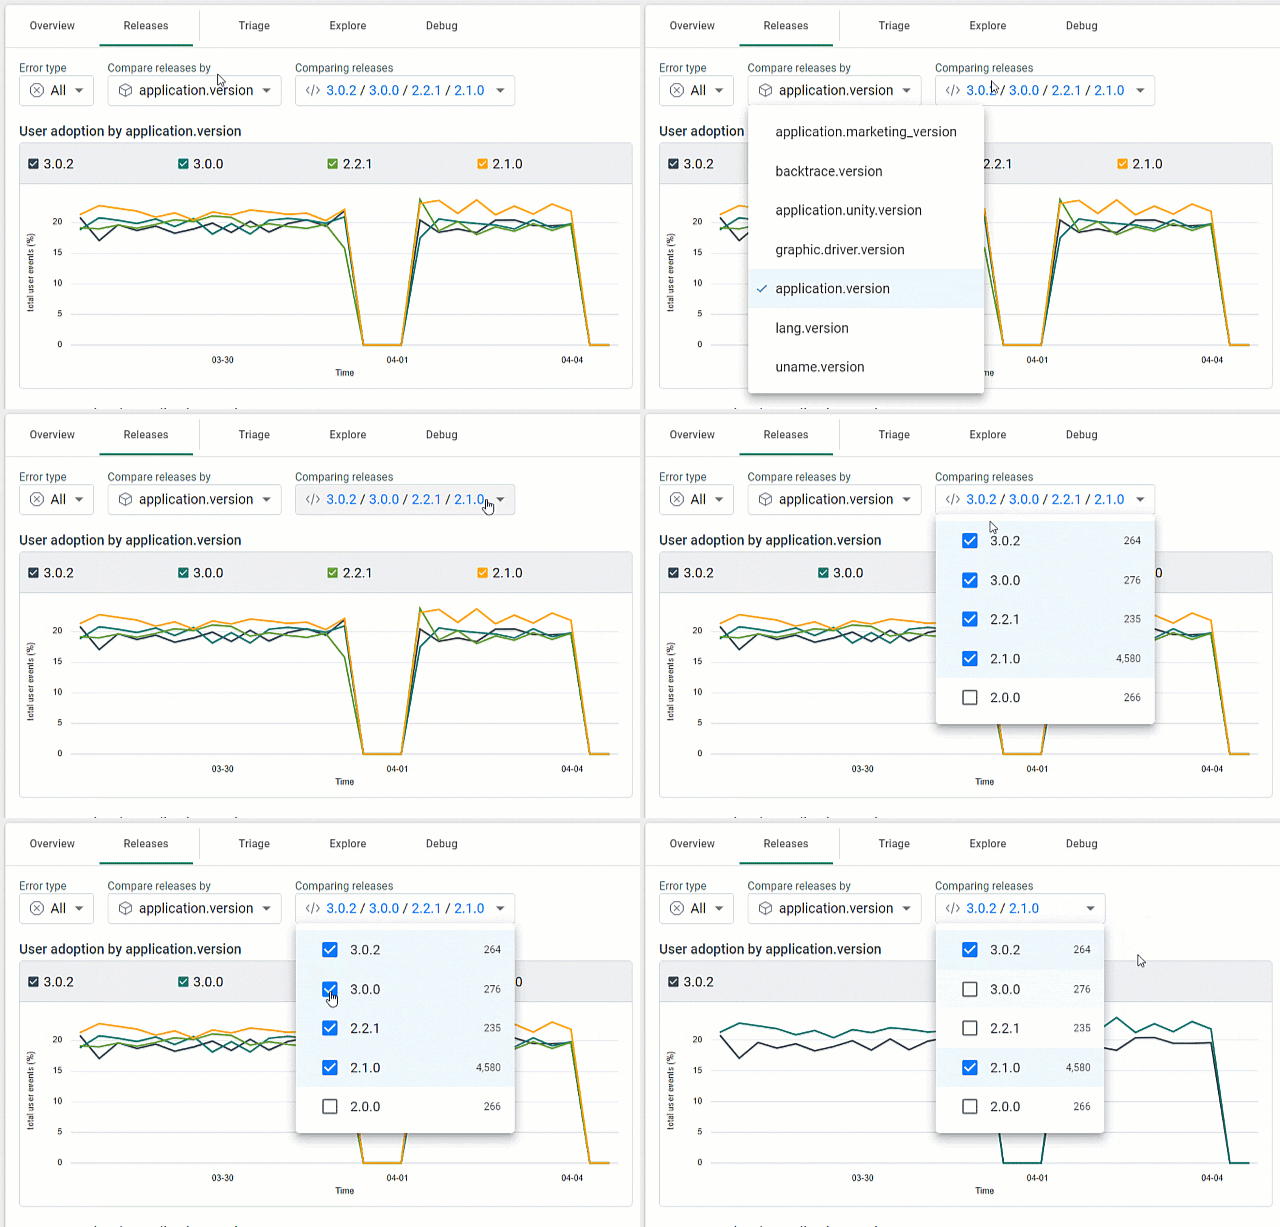
The Releases tab offers the convenience of being able to select the comparison type from a dropdown next to it. To the right of it, there is another dropdown that lets you compare different release versions and see all the data plotted on a chart.
Revitalized Triage View: Intuitive Navigation and Custom Views for Efficient Error Management
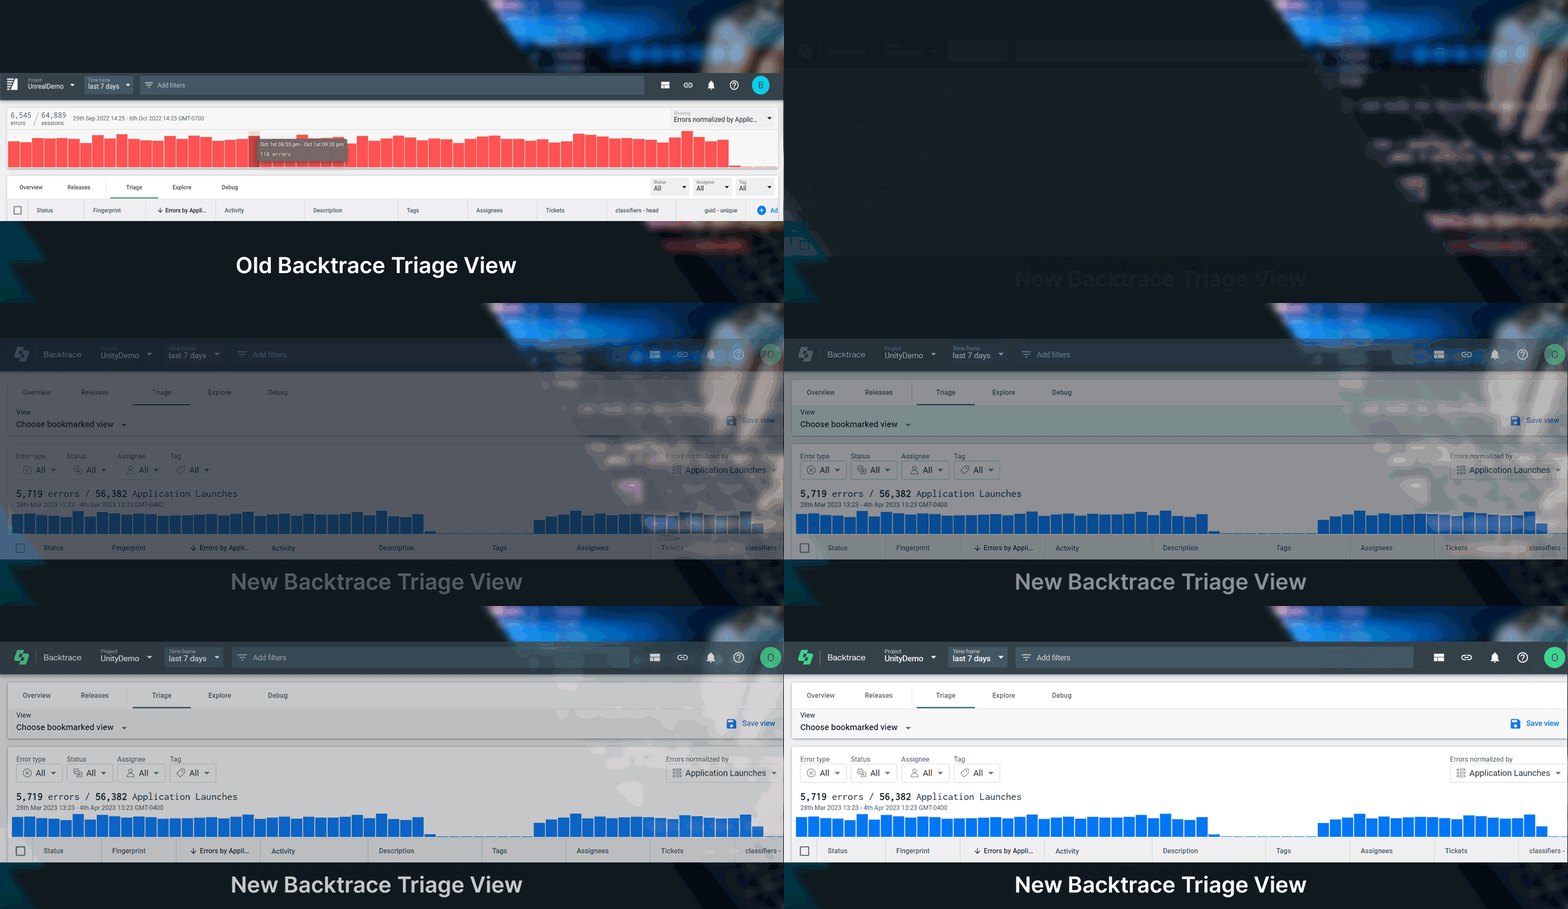
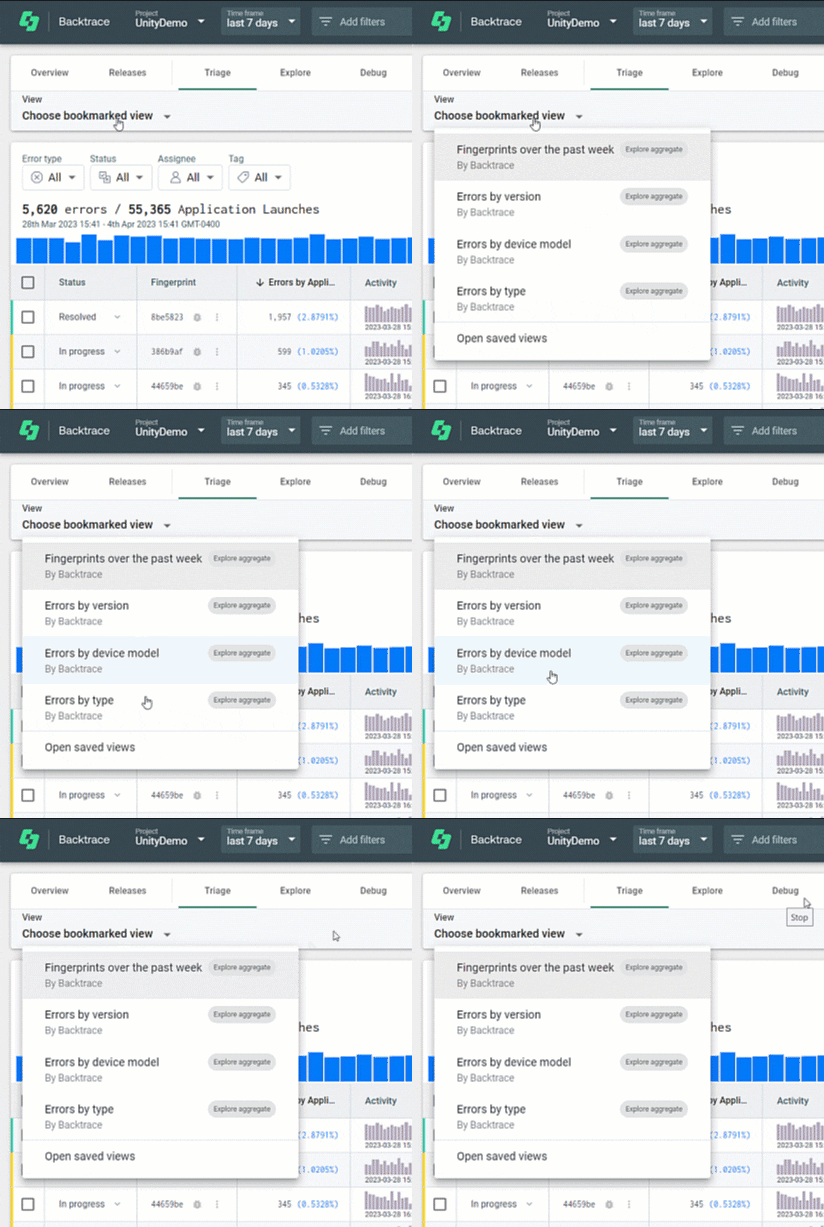
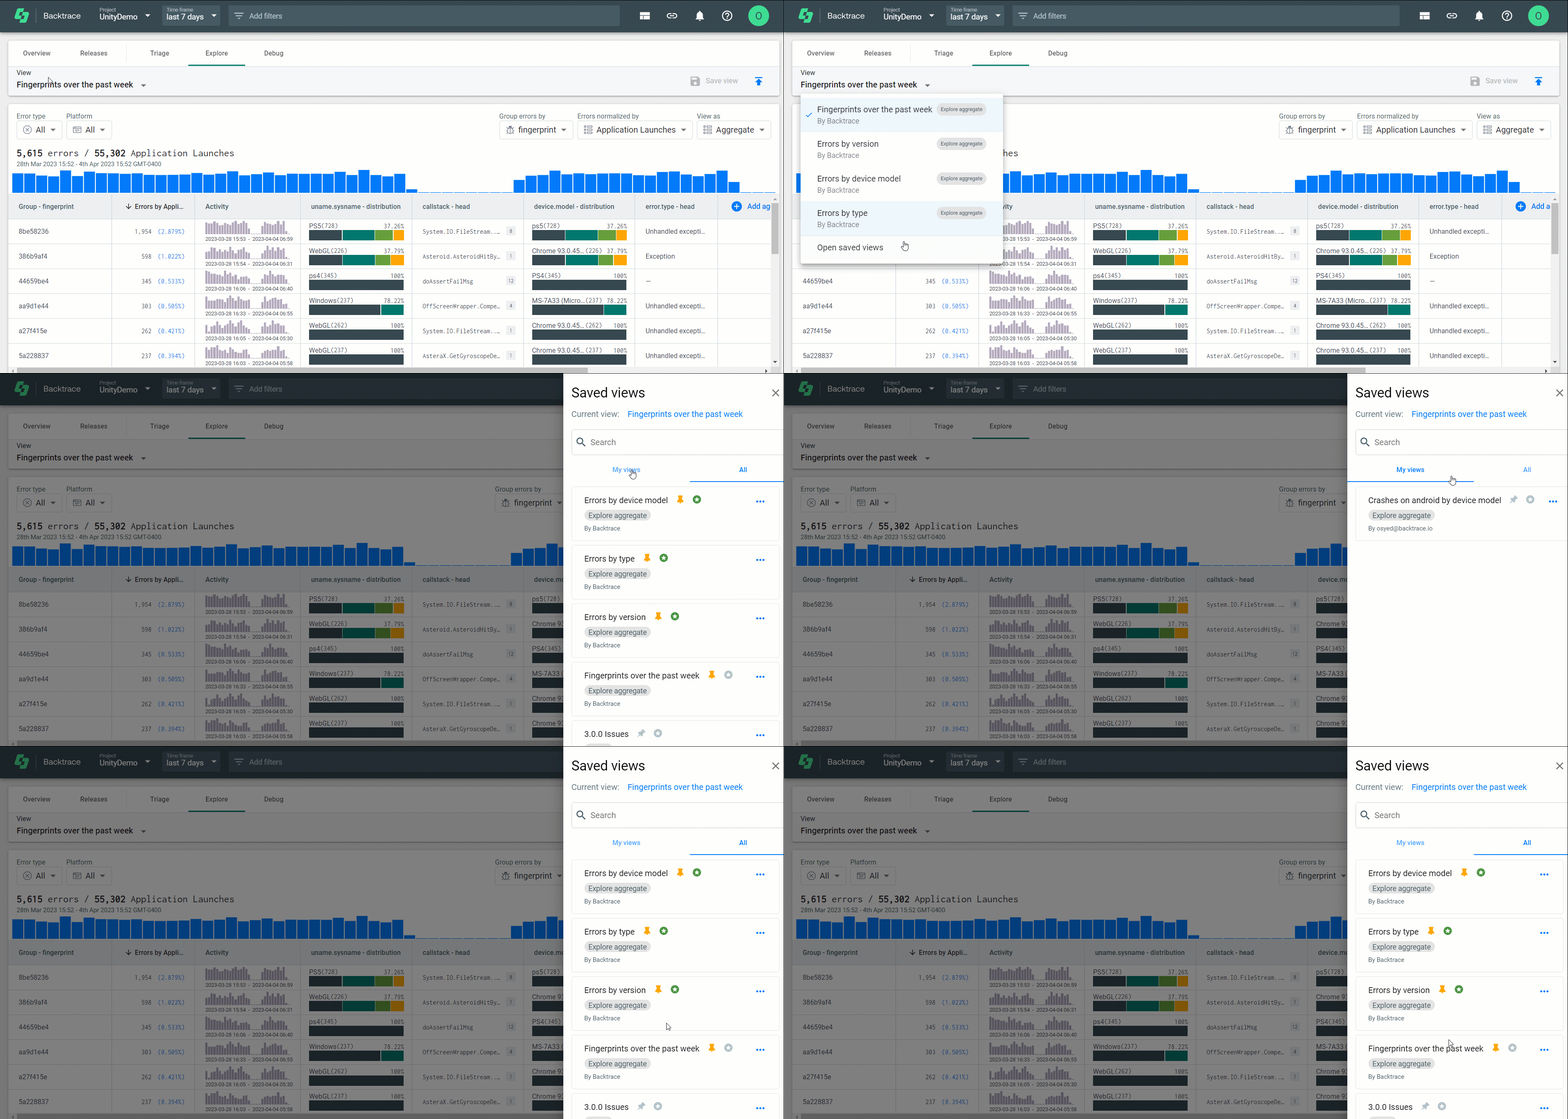
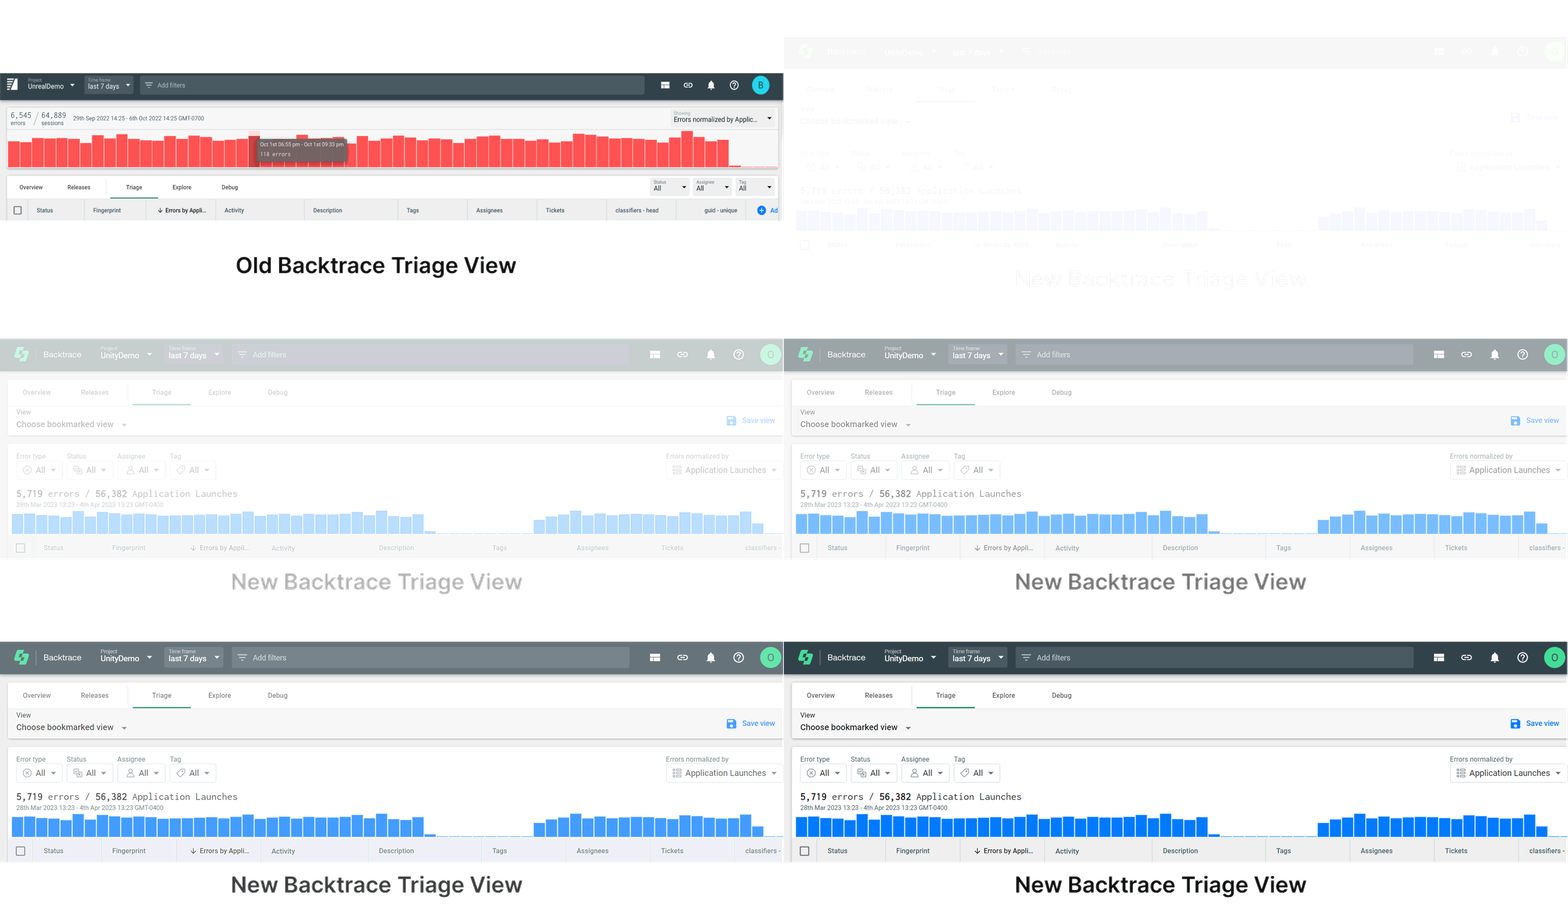
The Triage view has undergone a minor makeover and some great improvements. The timeline is now relocated below the quick to access dropdown filters, and there is a new dropdown on the top-left that lets you select various views. Backtrace has provided some views such as 'Fingerprints over the past week, errors by version, errors by device model, and errors by type.' If you want to access the saved views created by you or other members of your team, you can do so via the 'Open saved views' option at the end of this dropdown.
Customize and Save Views for Easy Access and Efficient Data Analysis
Saved views are an incredibly powerful feature that allow you to quickly and easily access the data that is most important to you. Whether you need to monitor specific error types or track down problems across multiple releases, saved views make it easy to get the data you need, when you need it. With the ability to save and share views across teams, you can collaborate more effectively and ensure that everyone is on the same page.
How to Save Custom Views
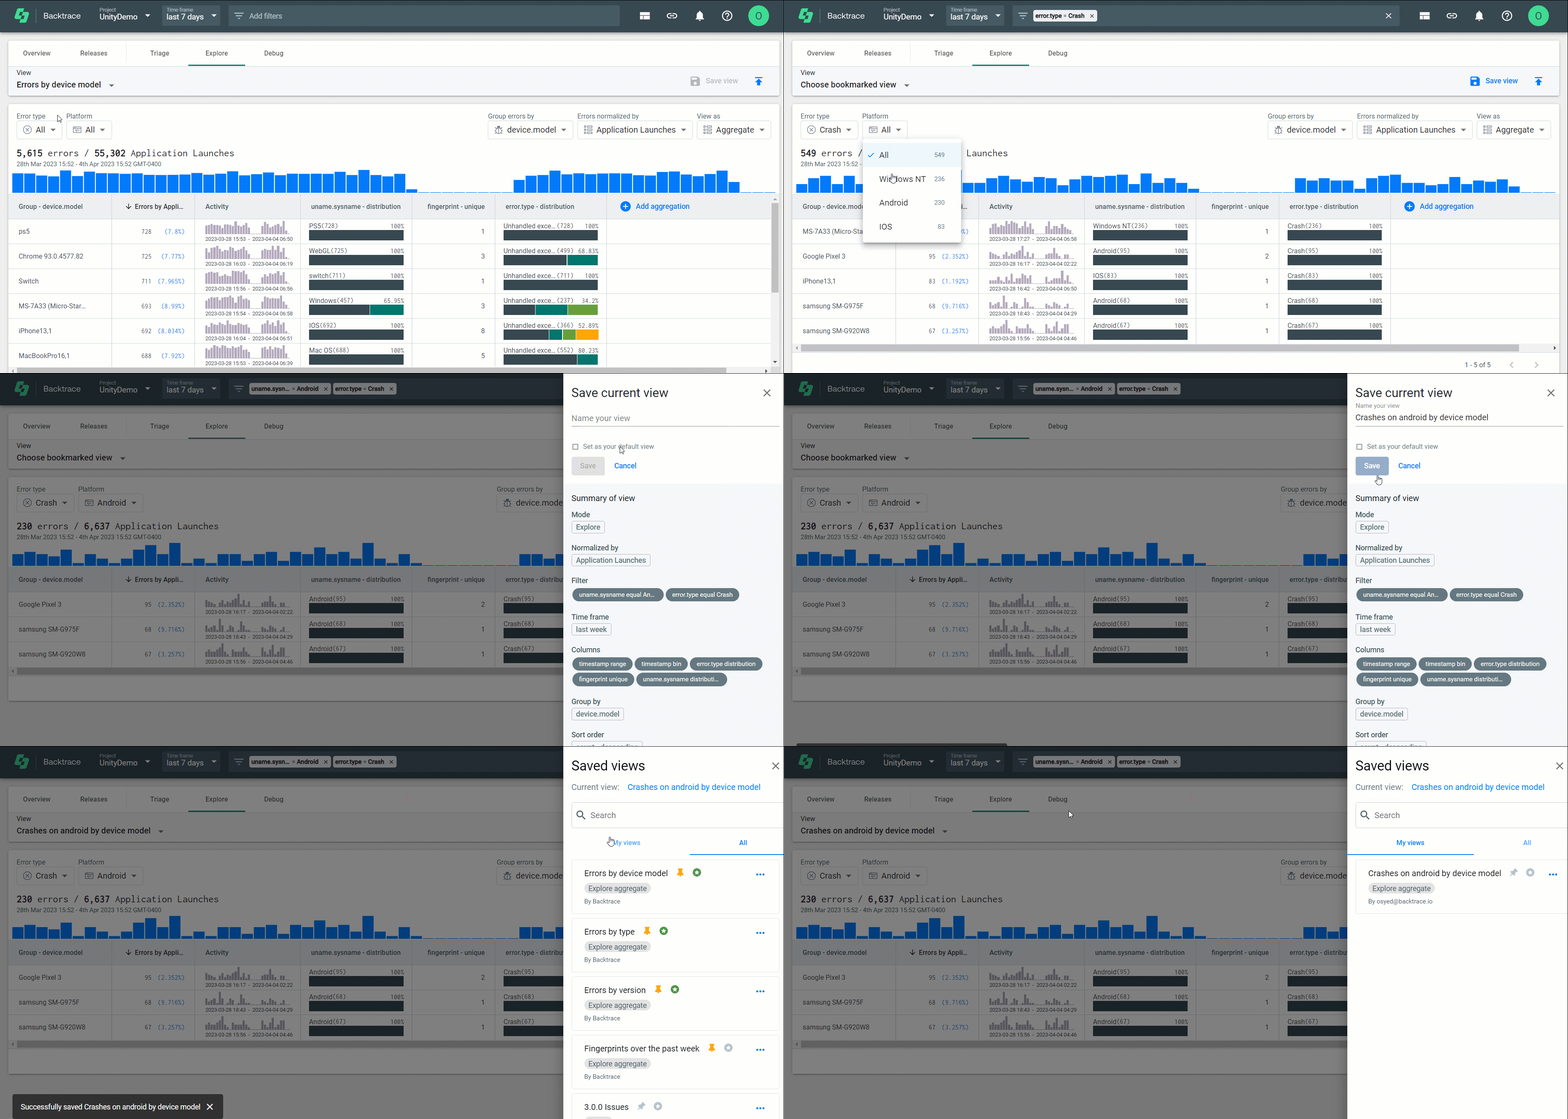
You can create a view to see all crashes that occurred on the Android platform and group them by the device model. You can select the 'Error type' as 'Crash', 'Platform' as 'Android', and select 'Group errors by' to 'device.model'. You can then use the 'Save view' button on the top right, label it, and save it to share it with your team. Additionally, it is possible to save views for both the triage view and the explore views.
Opening Saved Views Window
To open the saved views window, select 'Open saved views' from the 'View' dropdown in either the Triage or Explore tab. The saved views window will open on the right side of the screen, and you can choose between 'My views' and 'All' views that include every view created by any team member. There is also a search box that helps you search for a saved view.
Applying a Saved View
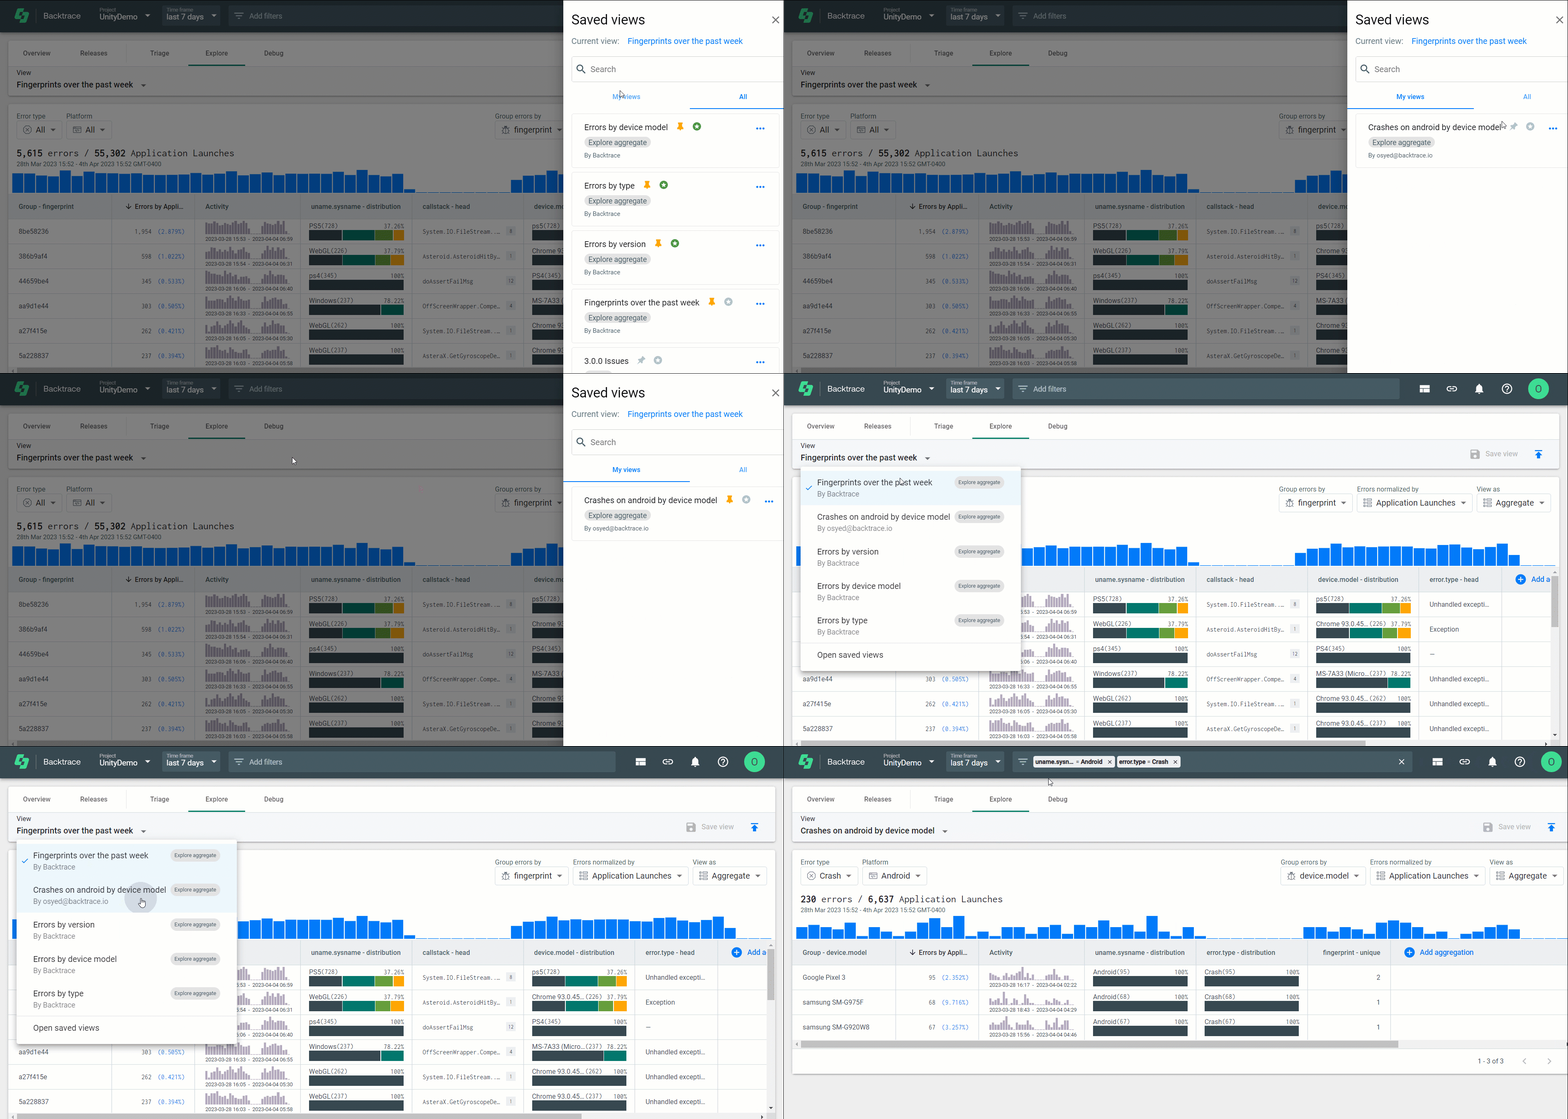
To apply a view previously created by you or another team member, open the 'Saved views' pane, and click on the '...' button to the right of the view you want to apply. From the dropdown, click 'Apply view.'
Bookmark a frequently used Saved-View
If you want to see a frequently used view under the 'view' dropdown, bookmark the view by clicking on the 'pin' icon next to the view under the 'saved views' pane. It will now appear under the 'views' dropdown.
Creating Advanced Views with QueryBuilder: Save Complex Queries with Ease
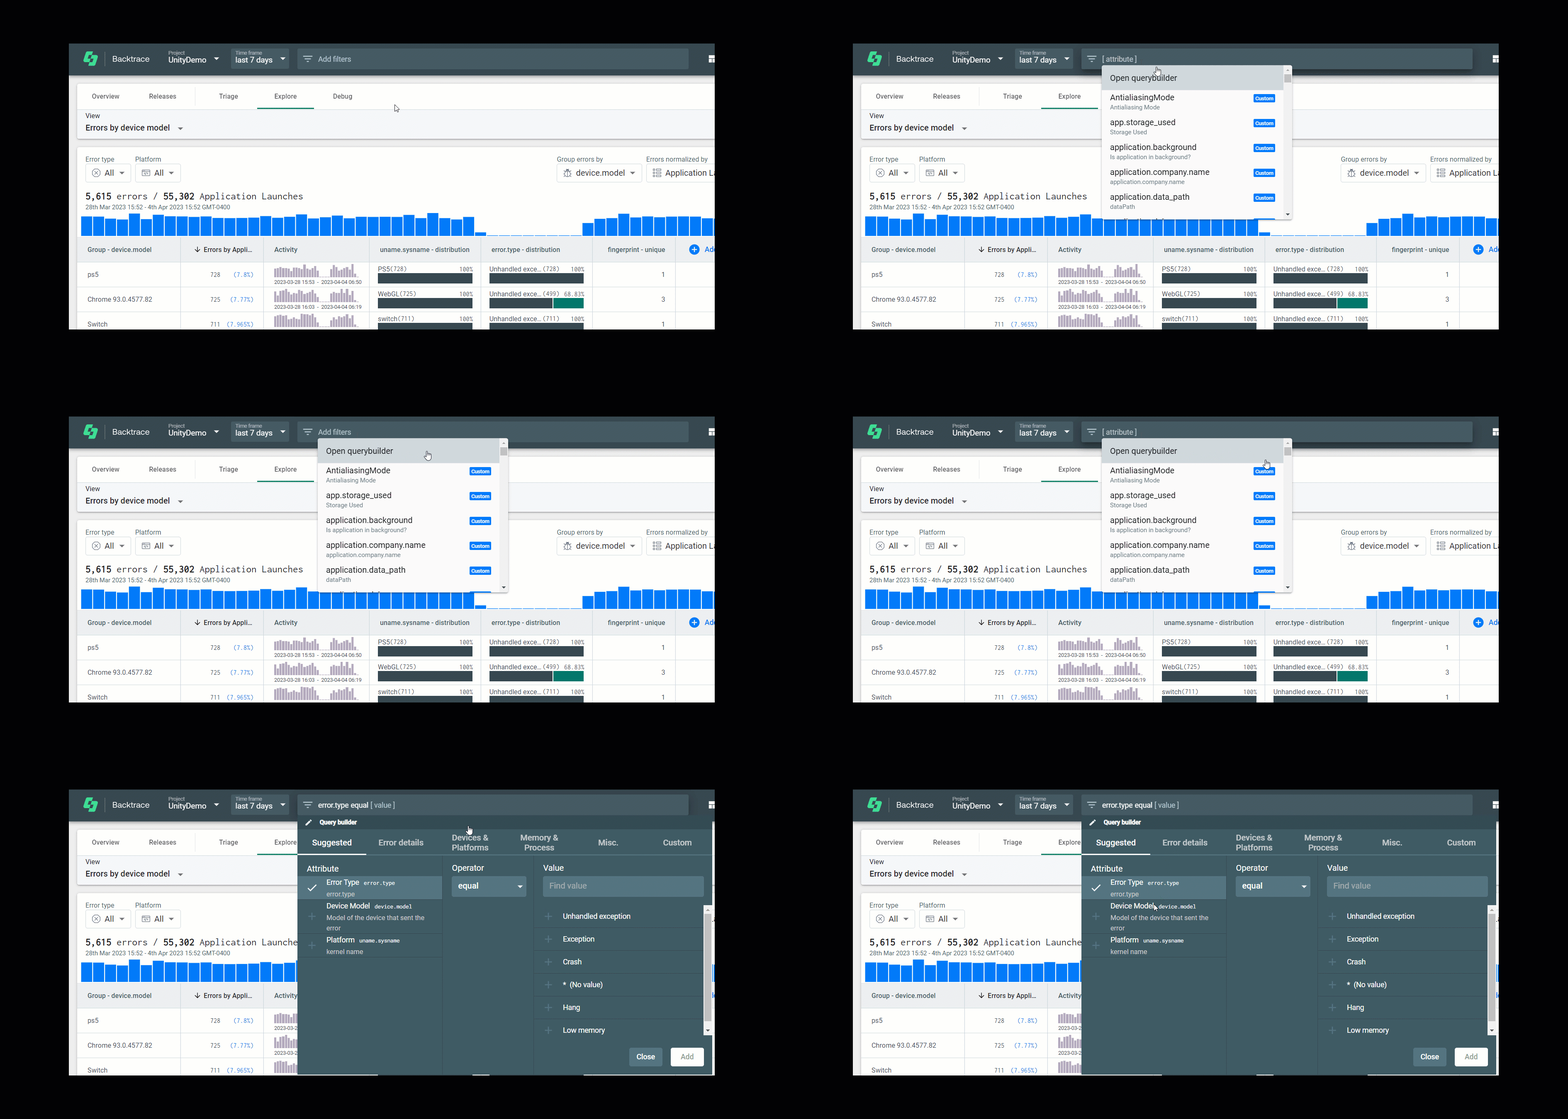
If you'd like to save complex views other than just the filters from the dropdowns, you can use Backtrace's proprietary advanced query engine to add more filters. Most recently, Backtrace introduced the QueryBuilder to make it even easier to build queries from an intuitive UI. Stay tuned for our next blog on QueryBuilder.
Try Backtrace in your next project
If you have not used Backtrace yet or if you are using another tool, new features like issue-based alerts and continuous improvements to our product including integrations like Jira are reasons you should be using Backtrace in your next project. You can get started with a free trial of the Backtrace by signing up here.
