Let's talk PC
Backtrace error, hang and crash reporting works in your language of choice to ensure you notice issues before you lose users.
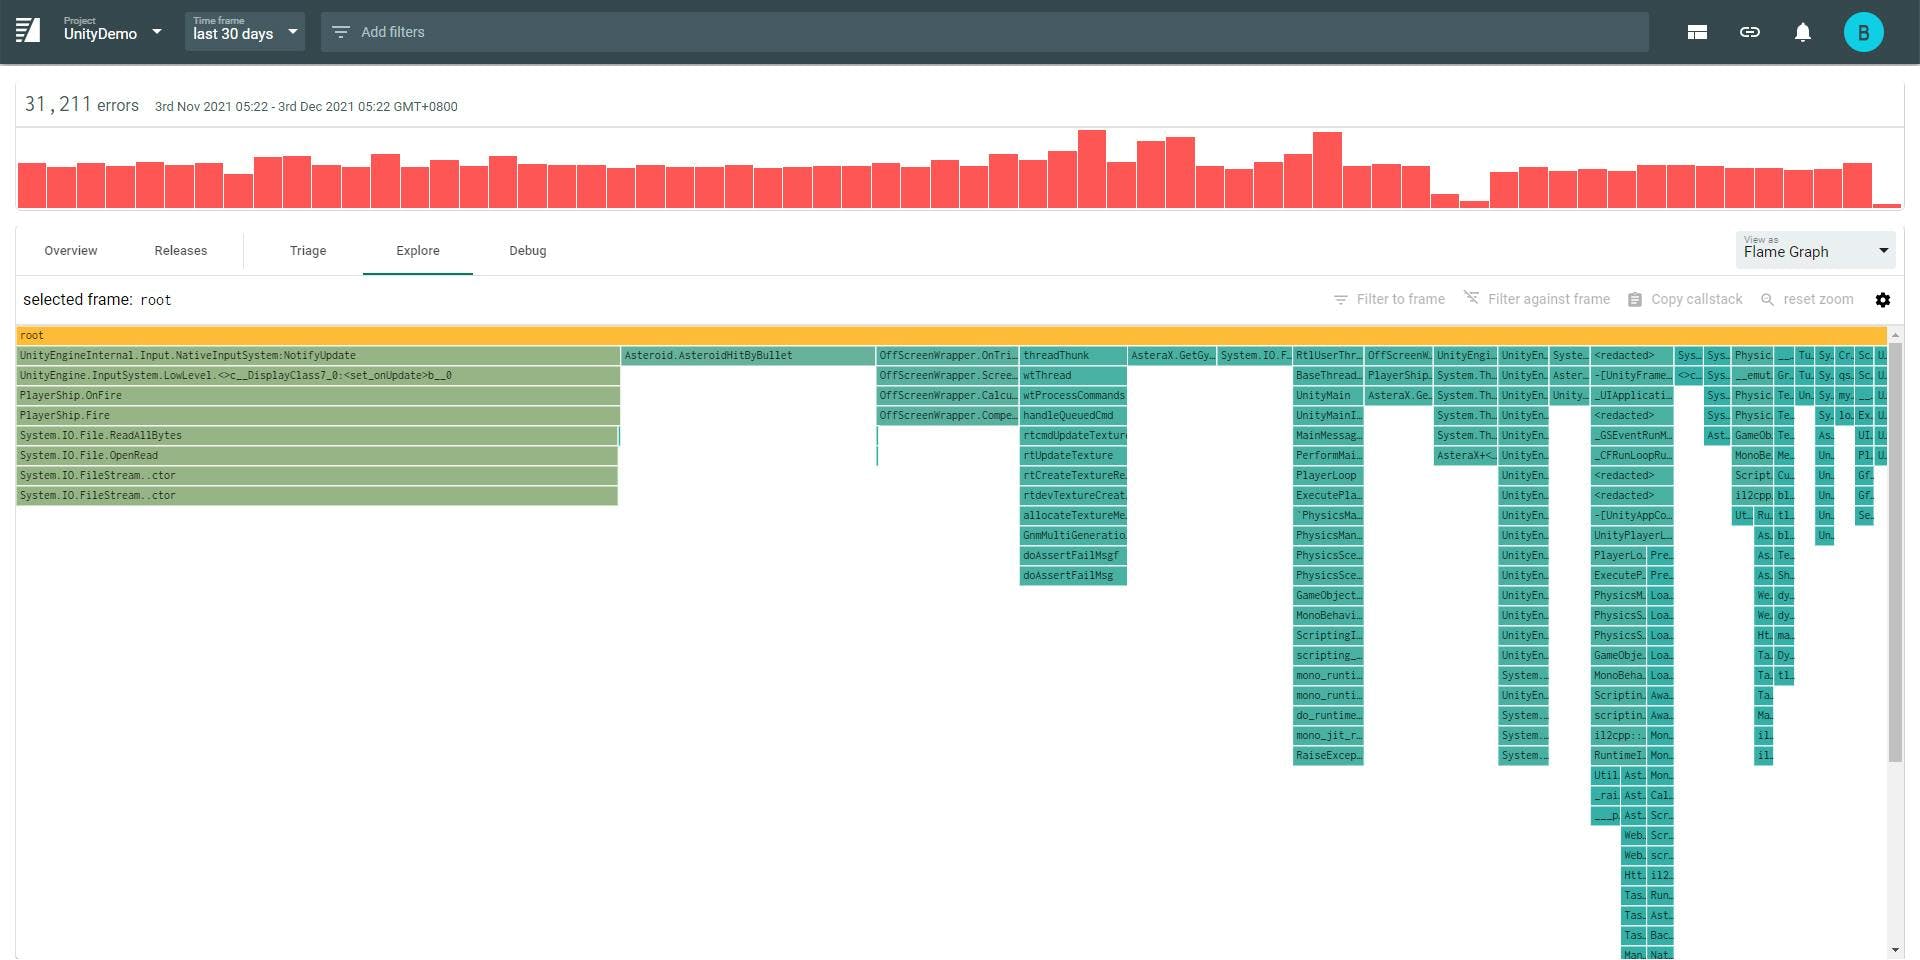
Fix bugs faster

Rich data
Backtrace provides accurate callstacks and extracts memory and variable values when possible to get you to the root cause faster.

Attachments
Our platform permits arbitrary assets to be associated with errors, including videos, screenshots, configuration files, logs, and more.

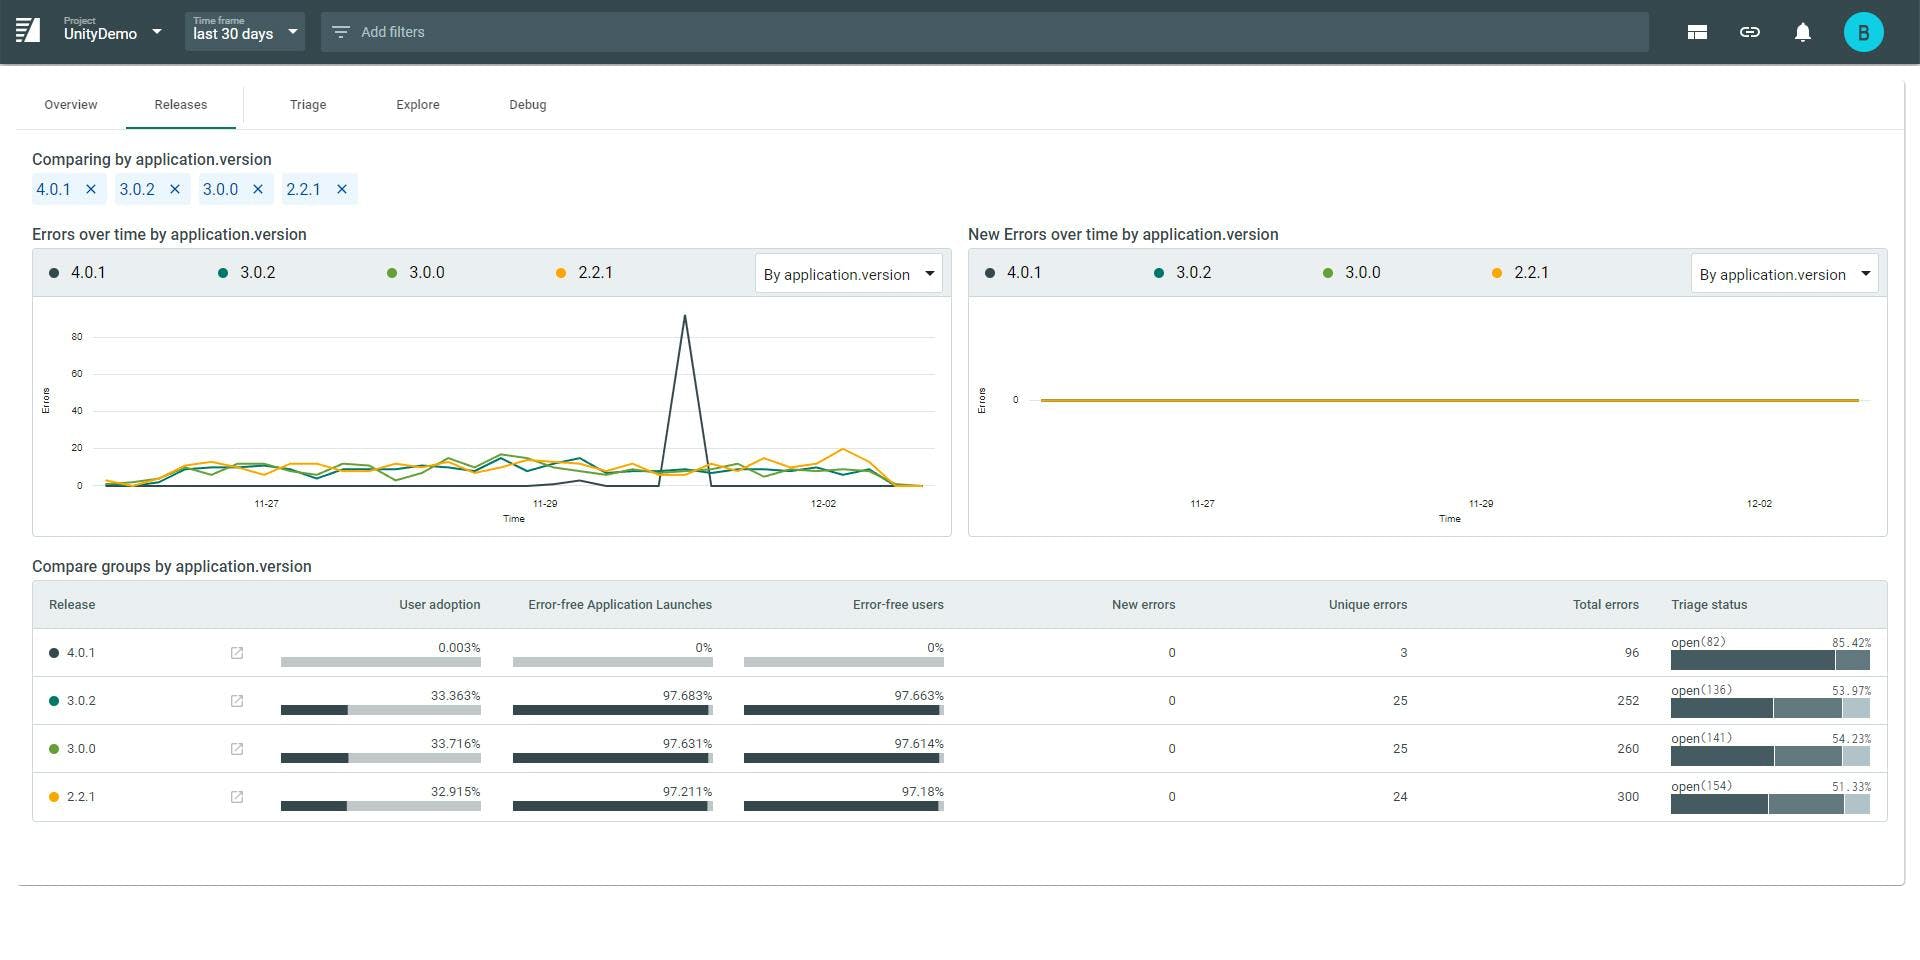
Consolidation
Ensure your developers get to the root cause faster by being able to directly isolate environmental factors including offending commit or release, contributing factors (such as a particular map) across all your platforms.

Enterprise-Grade Security and Privacy
Backtrace takes security seriously and ships with a myriad of security and privacy features, meeting or exceeding requirements for GDPR, SOC-2 and more.
- Access Control
- Audit Logs
- Compliance
- Multitenancy
- Encryption at rest
- Privacy shield certification
- Fine-grained retention policies
- PII scrubbing
- SSL encryption
Industry-leading Minidump support
Aggregate and make dump files actionable and accessible across your environments.
Dump storage
Your engineers can download and view dumps in their favorite debugger.
Attachment storage
Associate assets, like video files, logs, images, and more, with specific errors.
Symbol server support
Point to your own symbol servers so you get accurate symbolification, all the time.
Debug support
Full support for DWARF and the proprietary PDB / CodeView file format.

Get started with Linux
A plethora of options are available for natively compiled languages suited for your environment.
bcd
A light-weight open-source library that allows you to invoke the Backtrace debugger and aggregator reliably when your application has errors.
ptrace
A purpose-built debugger for UNIX and UNIX-like systems built from the ground-up for advanced analysis of application state during errors.
breakpad and crashpad
Popular open-source libraries brought to you by Google for cross-platform crash reporting with minidump files.
coresnap
Automatically manages all core dumps on your Linux and FreeBSD systems, including archival, aggregation and analysis.
json
For very small-form embedded devices, you may only have log files to go with. Translate your logs to JSON documents to turn them into actionable work with Backtrace.

macOS
Get going with industry-leading dump aggregation in minutes for macOS, iOS and tvOS.
Windows + Crashpad
Download Crashpad to get going with industry-leading crash and exception reporting for Windows applications in minutes.
Visual Studio Extension
The VS Extension automates most of the install, config and integration of Crashpad into your Windows C++ development.
Backtrace Binary
Backtrace maintains binary builds of Crashpad for Windows 32 and 64 bit systems. These builds include the ability to submit file attachments.
Backtrace fork
Backtrace provides source code to our fork of Crashpad. It is open source under the Apache License 2.0.
Upstream
Popular open-source libraries brought to you by Google for cross-platform crash reporting with minidump files.
Deployment Flexibility
Use Backtrace with our dedicated and multi-tenant hosting solution, or install it on-premises. It’s your choice!
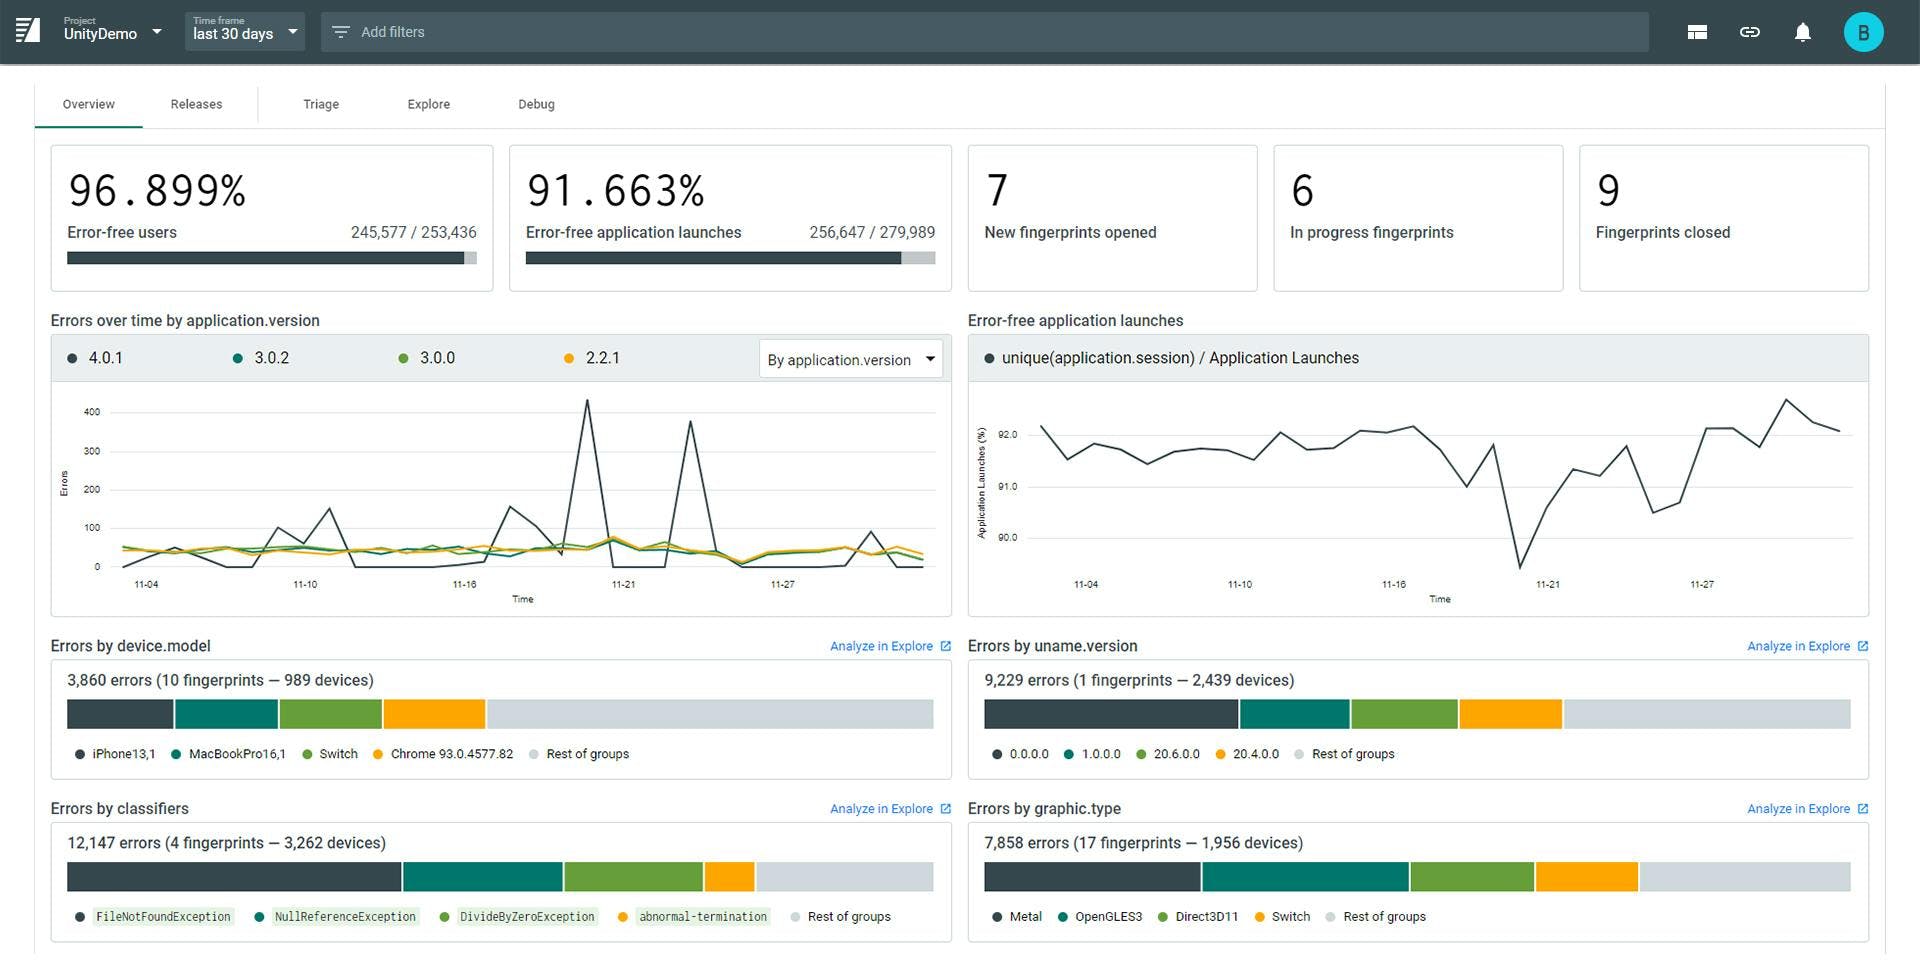
Triage effectively

Accurate, extensible, and customizable deduplication
Errors are deduplicated by error location and attribute similarity so you quickly determine how many users and instances are impacted by issues across your environments.

Rich workflow integrations
Backtrace seamlessly integrates into your engineering pipeline with support for popular alerting, notification, issue tracking and collaboration tools.

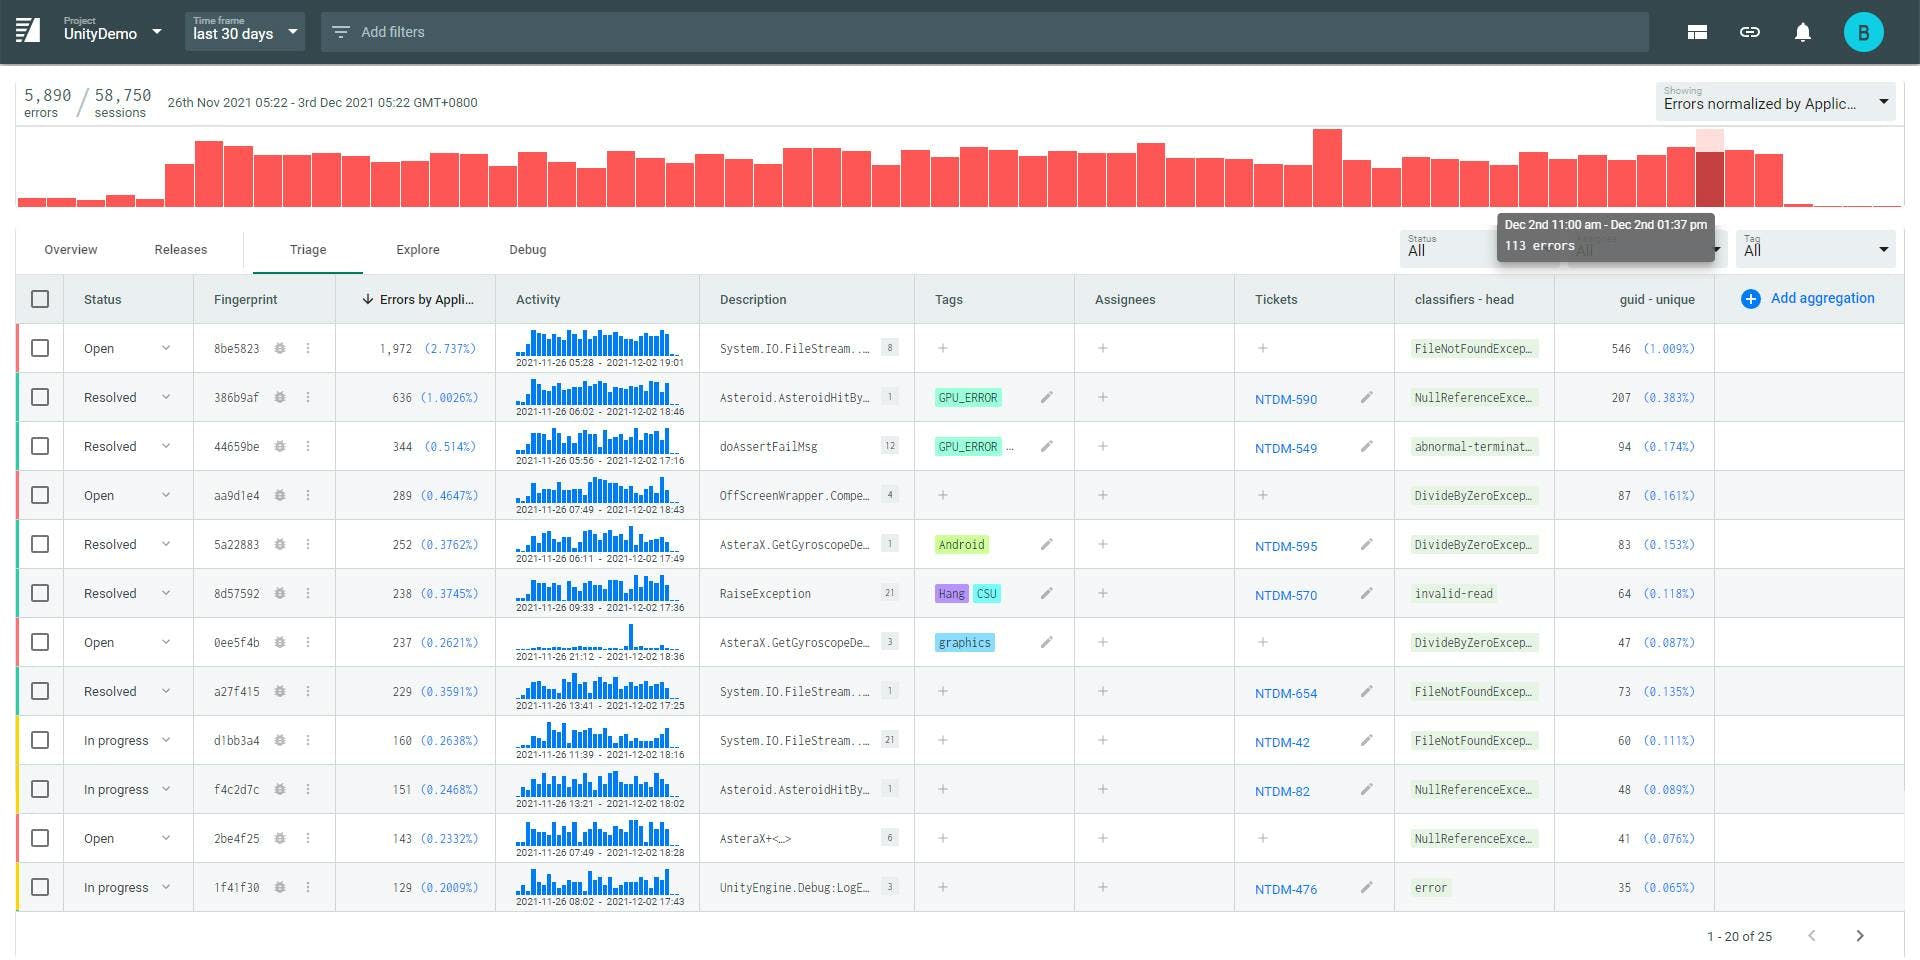
Powerful query capabilities
Easily filter to, exclude, group and aggregate on any attributes you send along with your errors. Filter on function names, modules, graphics cards and more.
Backtrace tracks errors across all major platforms
Backtrace takes all the manual labor out of cross-platform crash and exception management so you can focus on shipping.

Backtrace integrates into your workflow
Incorporate debug data into your existing workflow for SCM, alerting, ticket tracking, messaging, and more to enable seamless error management.