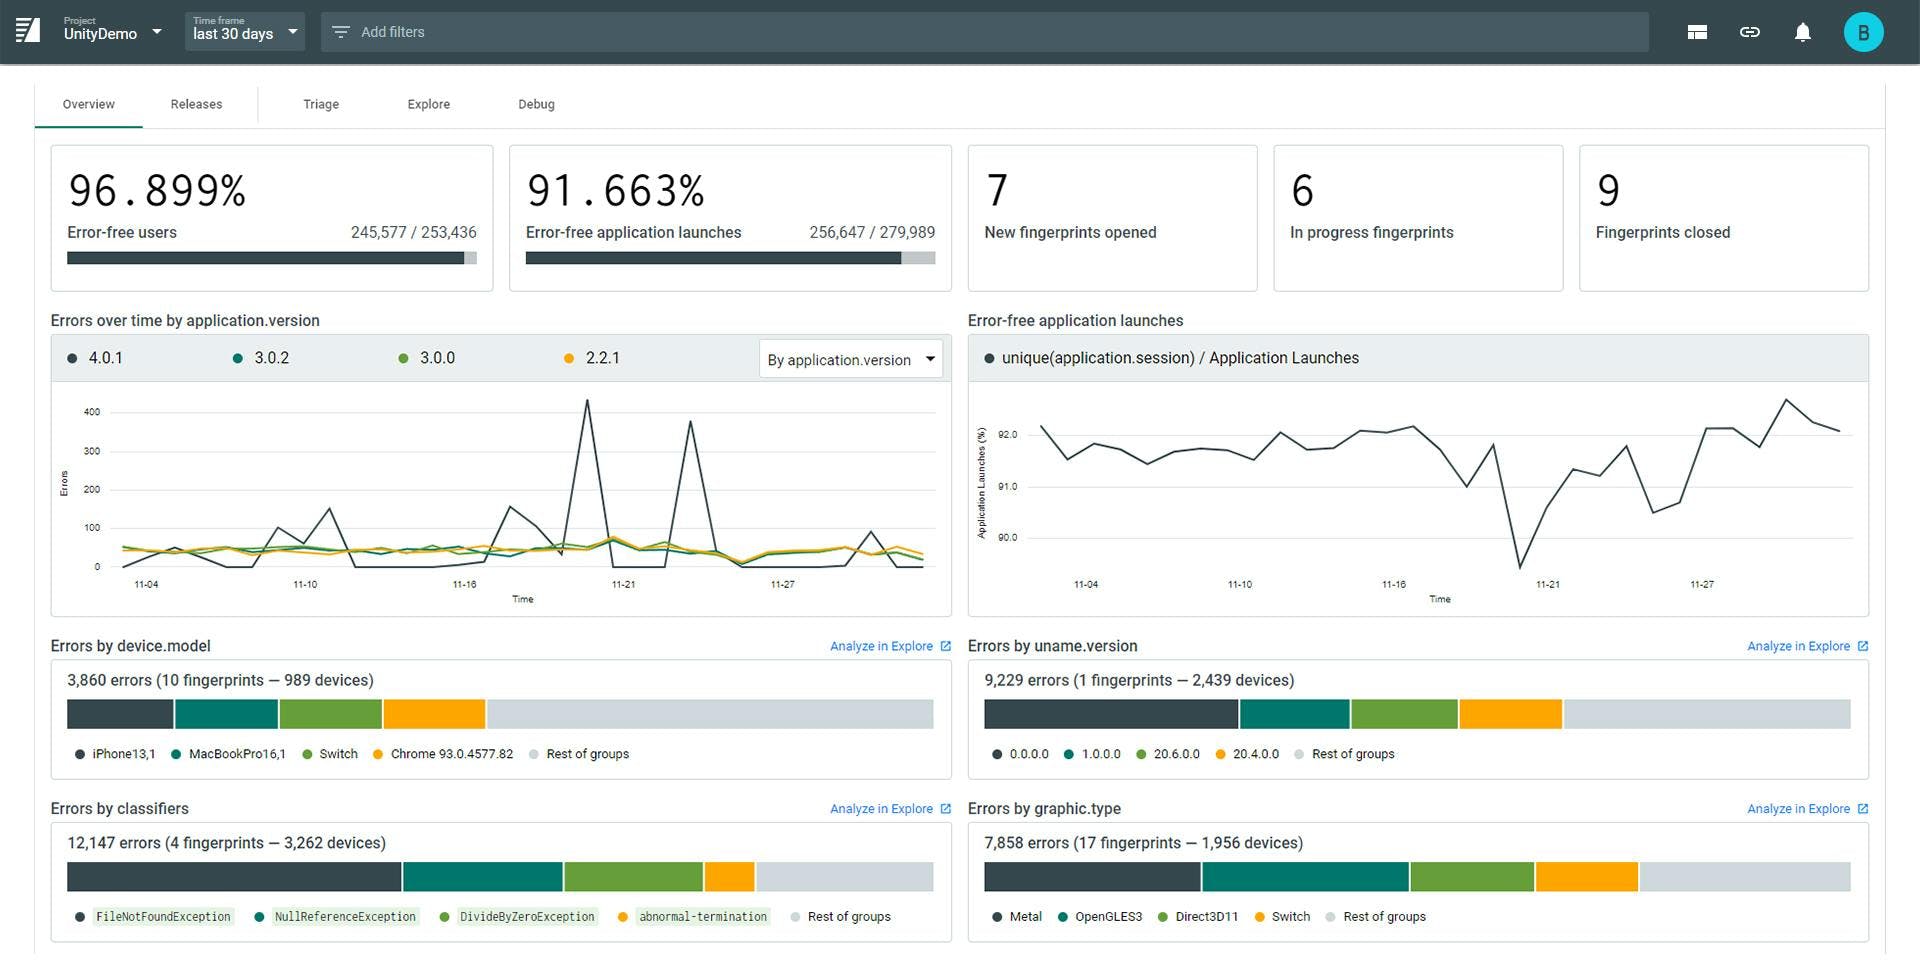
Go mobile with Backtrace
Backtrace error, hang and crash reporting works in your language of choice to ensure you notice issues before you lose users.
Fix bugs faster
Rich data
Backtrace provides accurate callstacks and extracts memory and variable values when possible to get you to the root cause faster.
Attachments
Our platform permits arbitrary assets to be associated with errors, including videos, screenshots, configuration files, logs, and more.
Consolidation
Ensure your developers get to the root cause faster by being able to directly isolate environmental factors including offending commit or release, contributing factors (such as a particular map) across all your platforms.
Enterprise-Grade Security and Privacy
Backtrace takes security seriously and ships with a myriad of security and privacy features, meeting or exceeding requirements for GDPR, SOC-2 and more.
- Access Control
- Audit Logs
- Compliance
- Multitenancy
- Encryption at rest
- Privacy shield certification
- Fine-grained retention policies
- PII scrubbing
- SSL encryption
Backtrace for Android
Accurate grouping of all your fatal and non-fatal errors in minutes. Install our open-source library to get started.
Address Android issues promptly
Capture all errors
Handled and unhandled exceptions, crashes, and application not responding (ANR) errors are all captured with simple controls for Kotlin and Java. ProGuard and R8 support deobfuscates your callstacks and allow you to view details such as function names, file paths, and line numbers.
Query everything
System information automatically includes device GUID, OS version, memory usage, process age, network, battery, and more. All metadata attributes are a first-class citizen in Backtrace. Query versions, functions, libraries, users and virtually any data you submit to quickly narrow down on impact and root-cause.
NDK support
Get access to raw memory dumps and more for native component crashes, giving a higher-level of observability than any other tool.
Backtrace for iOS
Get going with industry-leading dump aggregation in minutes for macOS, iOS and tvOS by installing our open-source pod for Swift and Objective-C applications.
Industry-leading Minidump support
Aggregate and make dump files actionable and accessible across your environments.
Dump storage
Your engineers can download and view dumps in their favorite debugger.
Attachment storage
Associate assets, like video files, logs, images, and more, with specific errors.
Symbol server support
Point to your own symbol servers so you get accurate symbolification, all the time.
Debug support
Full support for DWARF and the proprietary PDB / CodeView file format.
Deployment Flexibility
Use Backtrace with our dedicated and multi-tenant hosting solution, or install it on-premises. It’s your choice!
Triage effectively
Accurate, extensible and customizable deduplication
Errors are deduplicated by error location and attribute similarity so you quickly determine how many users and instances are impacted by issues across your environments.
Rich workflow integrations
Backtrace seamlessly integrates into your engineering pipeline with support for popular alerting, notification, issue tracking and collaboration tools.
Powerful query capabilities
Easily filter to, exclude, group and aggregate on any attributes you send along with your errors. Filter on function names, modules, graphics cards and more.
Backtrace tracks errors across all major platforms
Backtrace takes all the manual labor out of cross-platform crash and exception management so you can focus on shipping.
Backtrace integrates into your workflow
Incorporate debug data into your existing workflow for SCM, alerting, ticket tracking, messaging, and more to enable seamless error management.

