
Backtrace Blog
For the latest developments from our engineering team, head over to the Engineering Blog at engineering.backtrace.io.
Using the Unity Memory Profiler to Troubleshoot Out-of-memory issues
When it comes to monitoring Unity game builds for possible memory issues, the Unity memory profiler module is an important tool. While the built-in Memory Profiler under the Profiler window gives you basic information about the memory, the additional downloadable Memory Profiler package can be used to analyze your game’s memory usage in detail. When combined with Backtrace’s ability to detect out-of-memory issues on mobile platforms, you can efficiently find and fix problems before they ruin game performance and impact game experience.
When it comes to monitoring Unity game builds for possible memory issues, the Unity memory profiler module is an important tool. While the built-in Memory Profiler under the Profiler window gives you basic information about the memory, the additional downloadable Memory Profiler package can be used to analyze your game’s memory usage in detail. When combined with Backtrace’s ability to detect out-of-memory issues on mobile platforms, you can efficiently find and fix problems before they ruin game performance and impact game experience.
Unity Memory Profiler Module
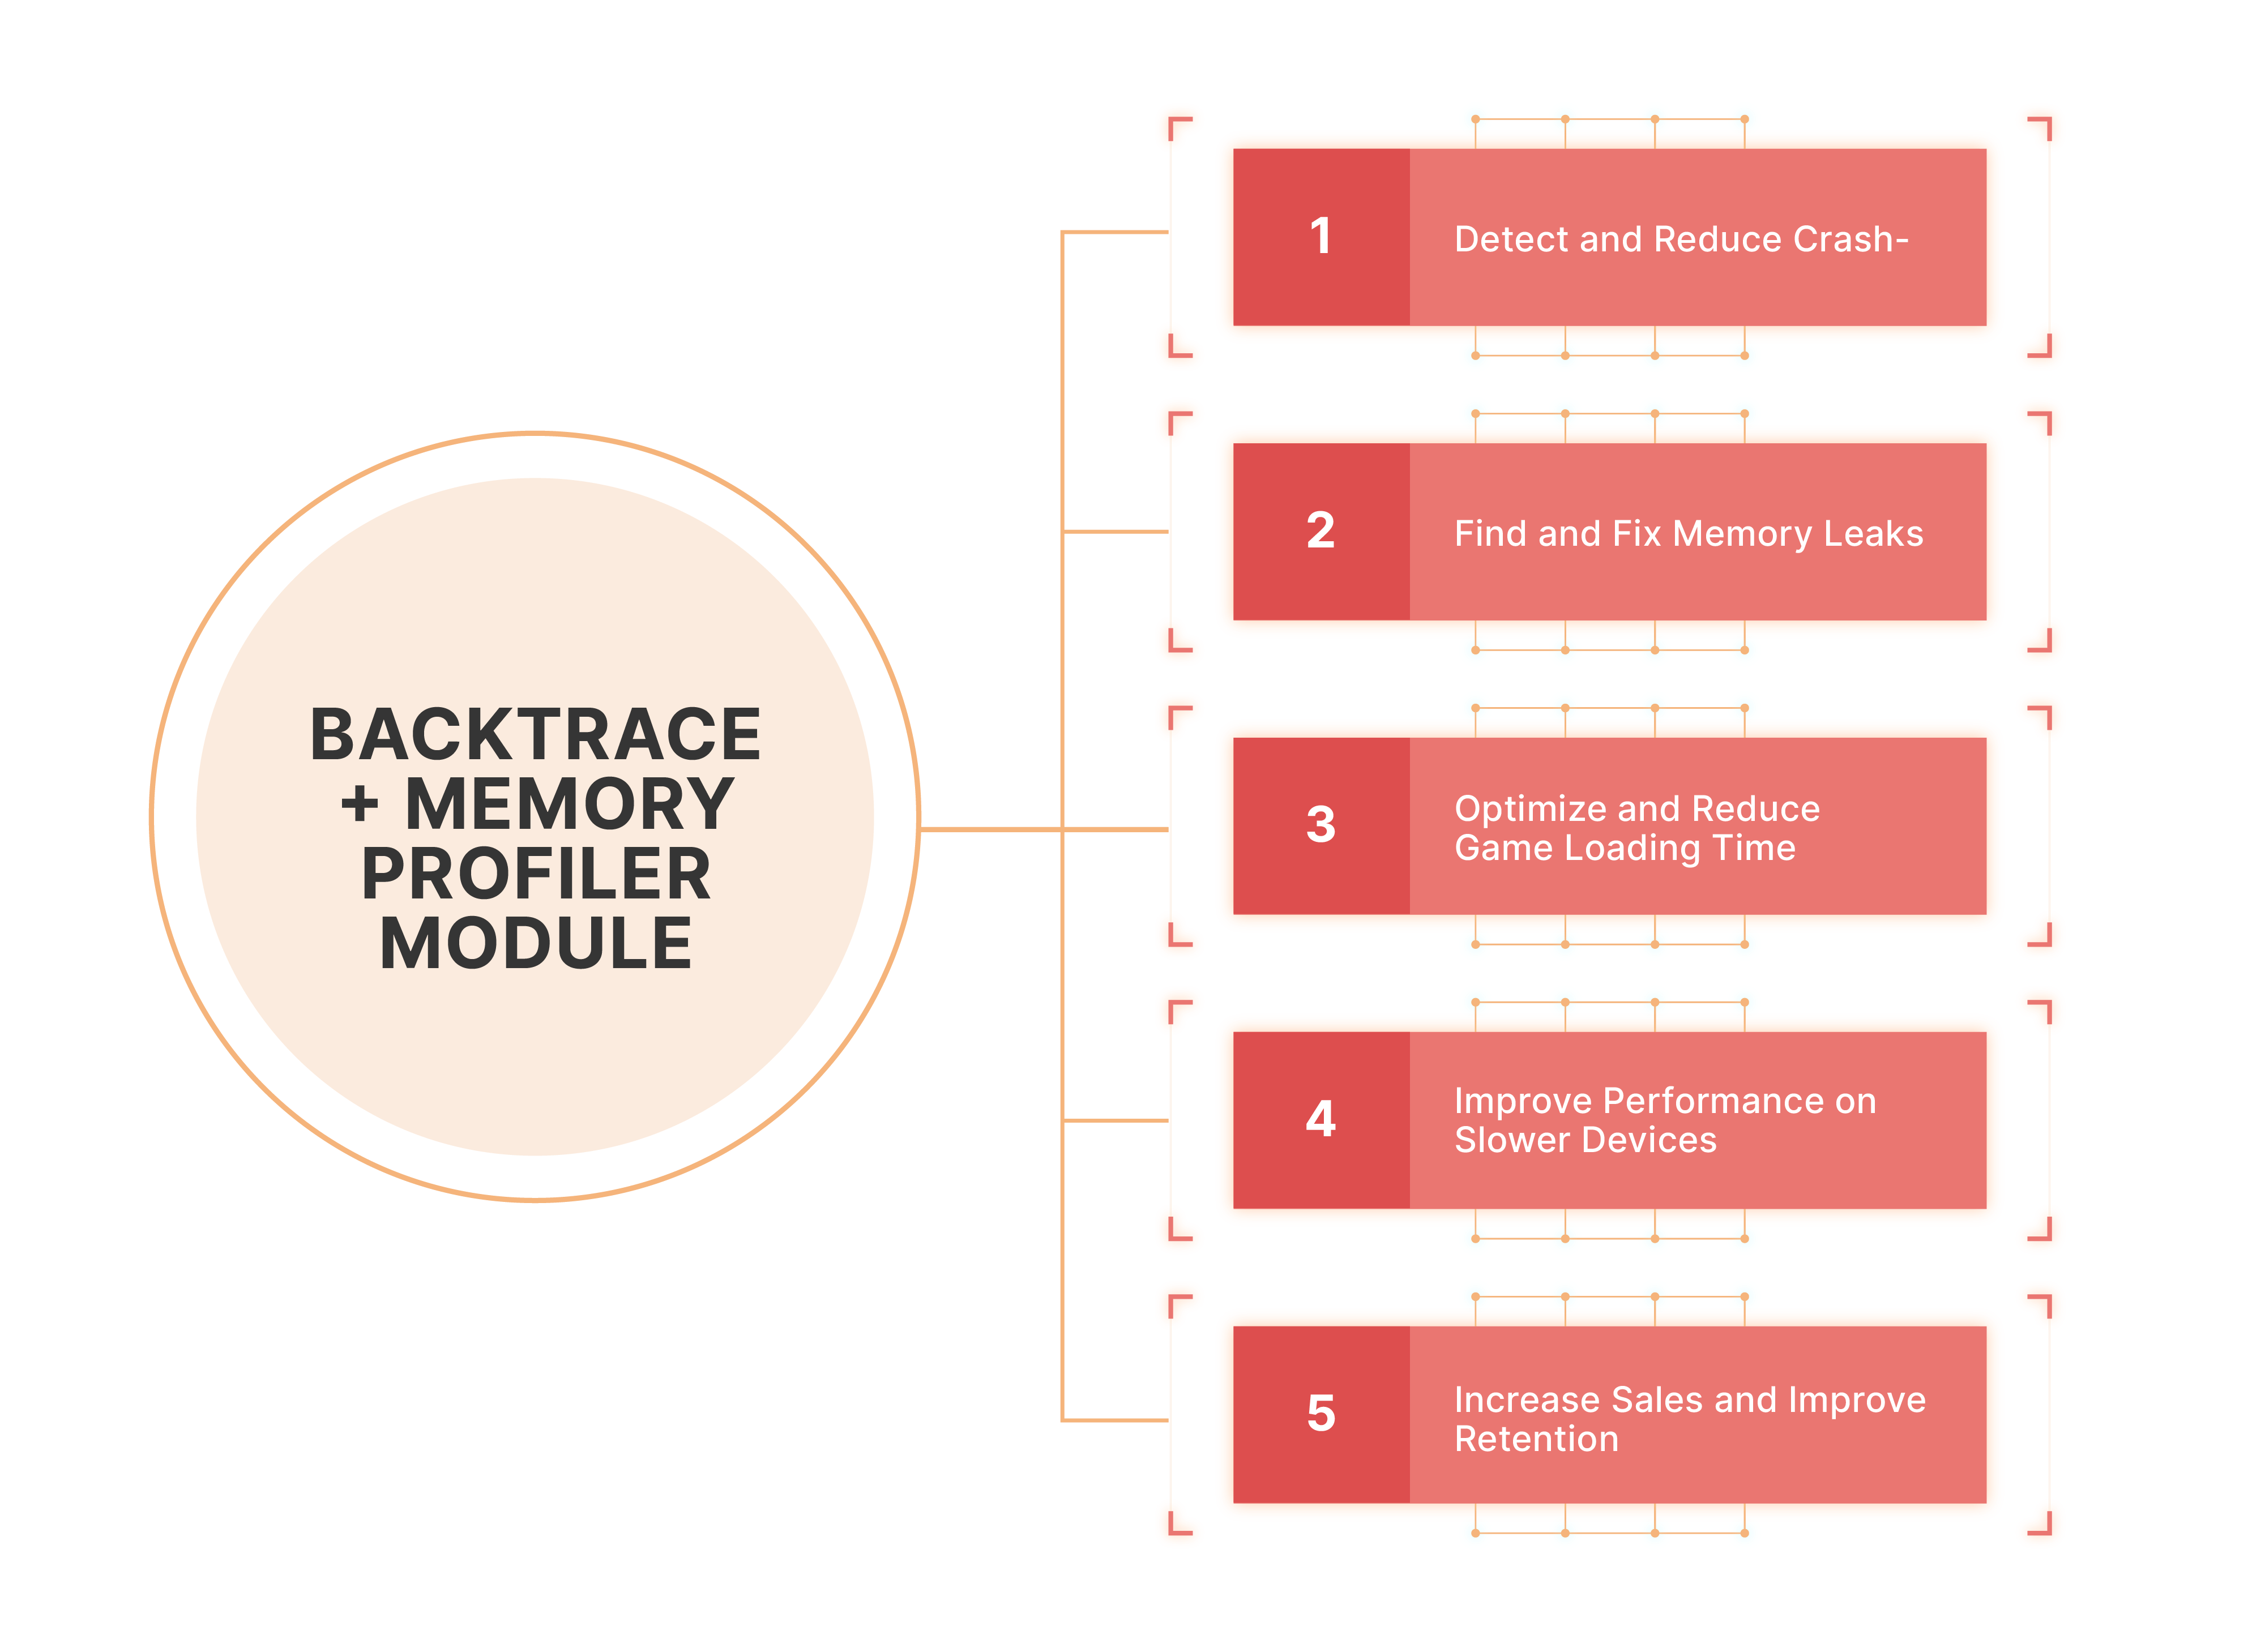
The Unity Memory Profiler Module can be installed in any Unity Project to detect and resolve memory leaks, reduce ANRs, hangs and crashes and optimize game loading times. When combined with Backtrace, you can not only improve performance on slower devices but also target those devices that were previously out of reach due to higher memory requirements, thereby leading to increased sales and improved customer retention.
Memory Snapshot
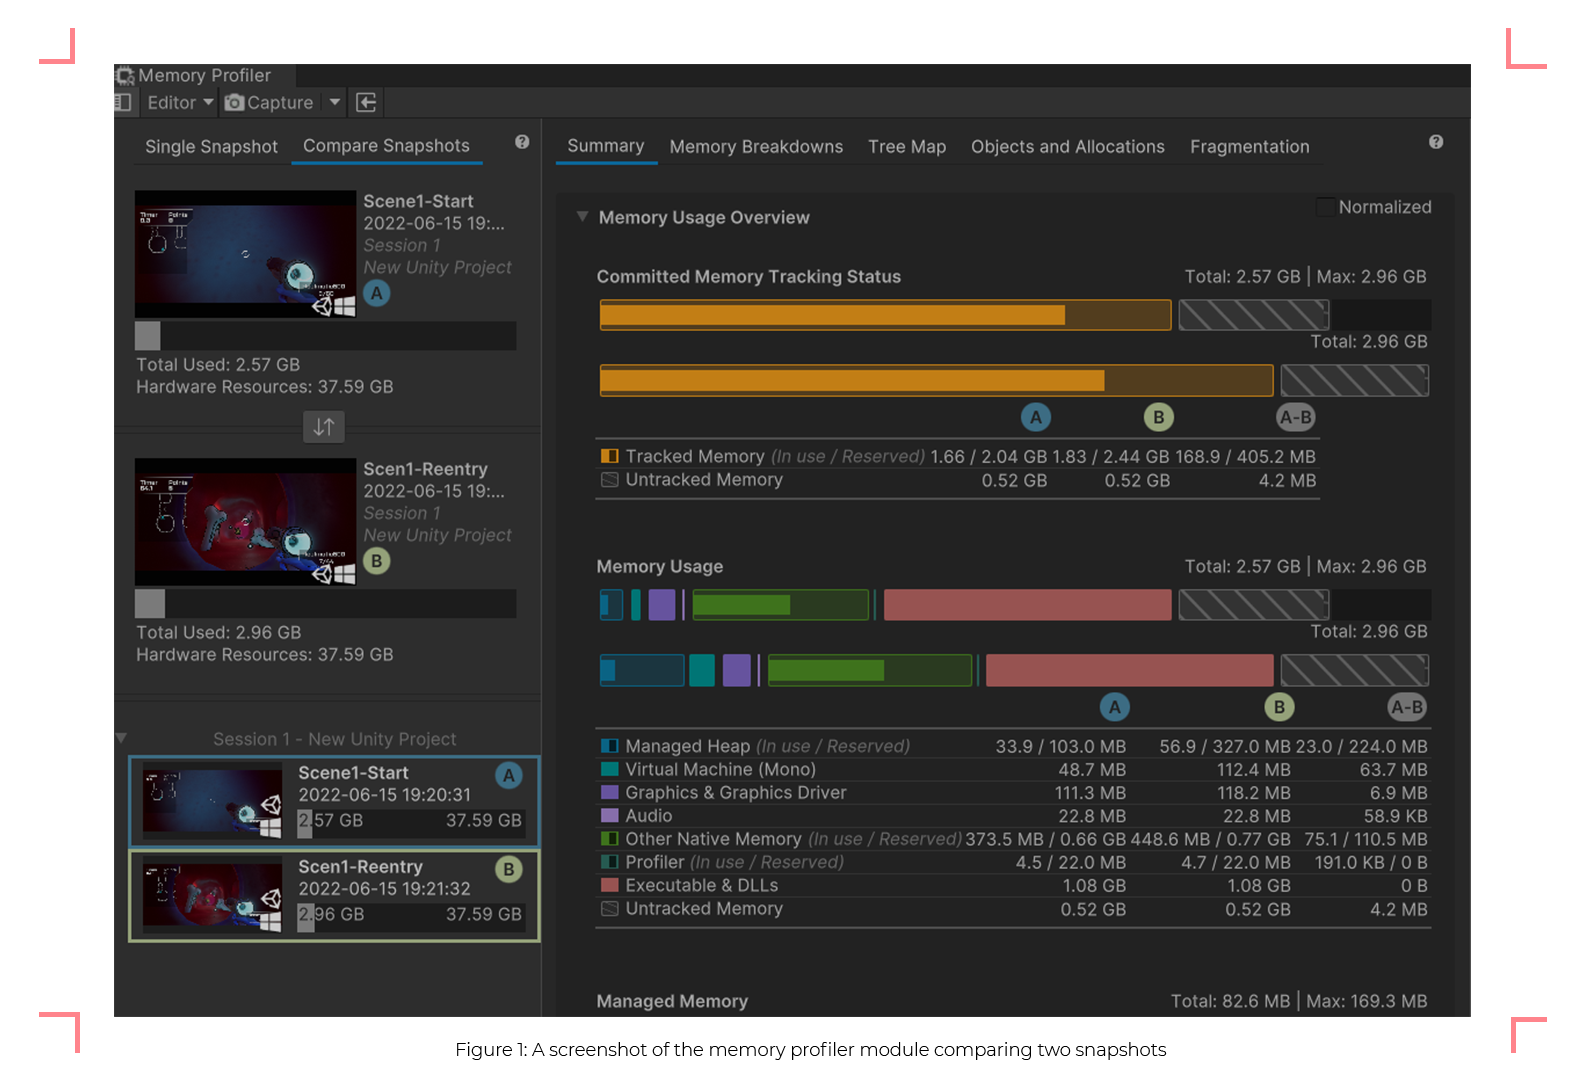
One of the most useful features of the Memory Profiler is the ability to take snapshots of different points in time during the gameplay. The memory profiler lets you store and compare snapshots to check for potential sources of memory leaks by using a ‘diff’-like tool.
When two snapshots are compared, you can potentially find issues that previously went undetected. For instance, if there are more new objects detected in the second scene than the first, then that could point to a memory leak. Additionally, you can compare both snapshots to see if the second snapshot consumes a lot more memory than the first one and take action as appropriate to fix the leak.
Tree Map
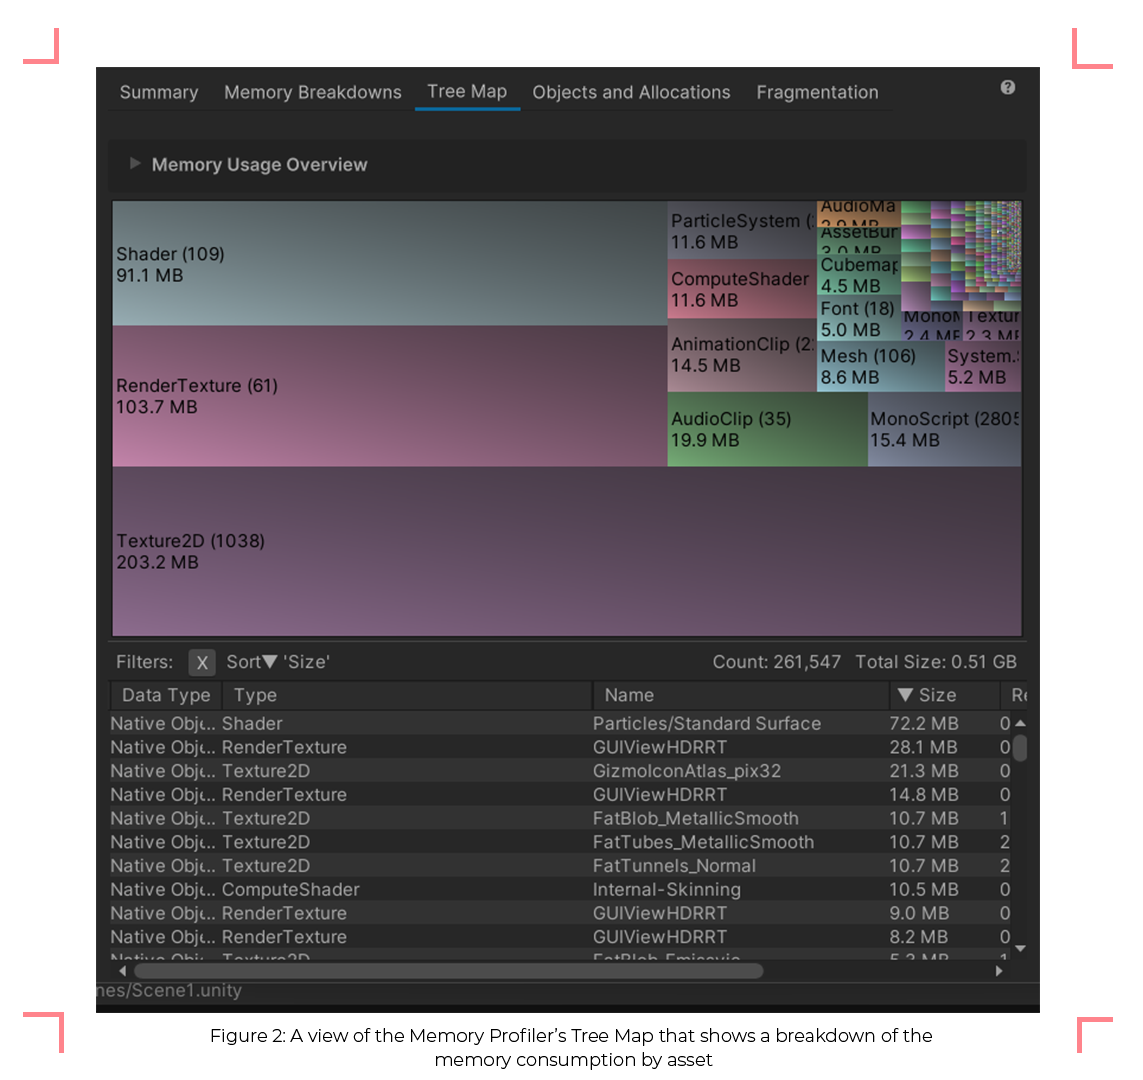
Another useful feature of the Memory Profiler Module is the Tree Map. It allows you to visualize which of the assets used in the scene consumes the most memory. Therefore, the Tree Map can be used to quickly check and optimize the memory footprint of your game. If you see that there is a specific asset such as a texture taking up a chunk of your memory, then it can be investigated further. On mobile devices, one common oversight is to forget compressing an imported uncompressed texture.
Memory Fragmentation
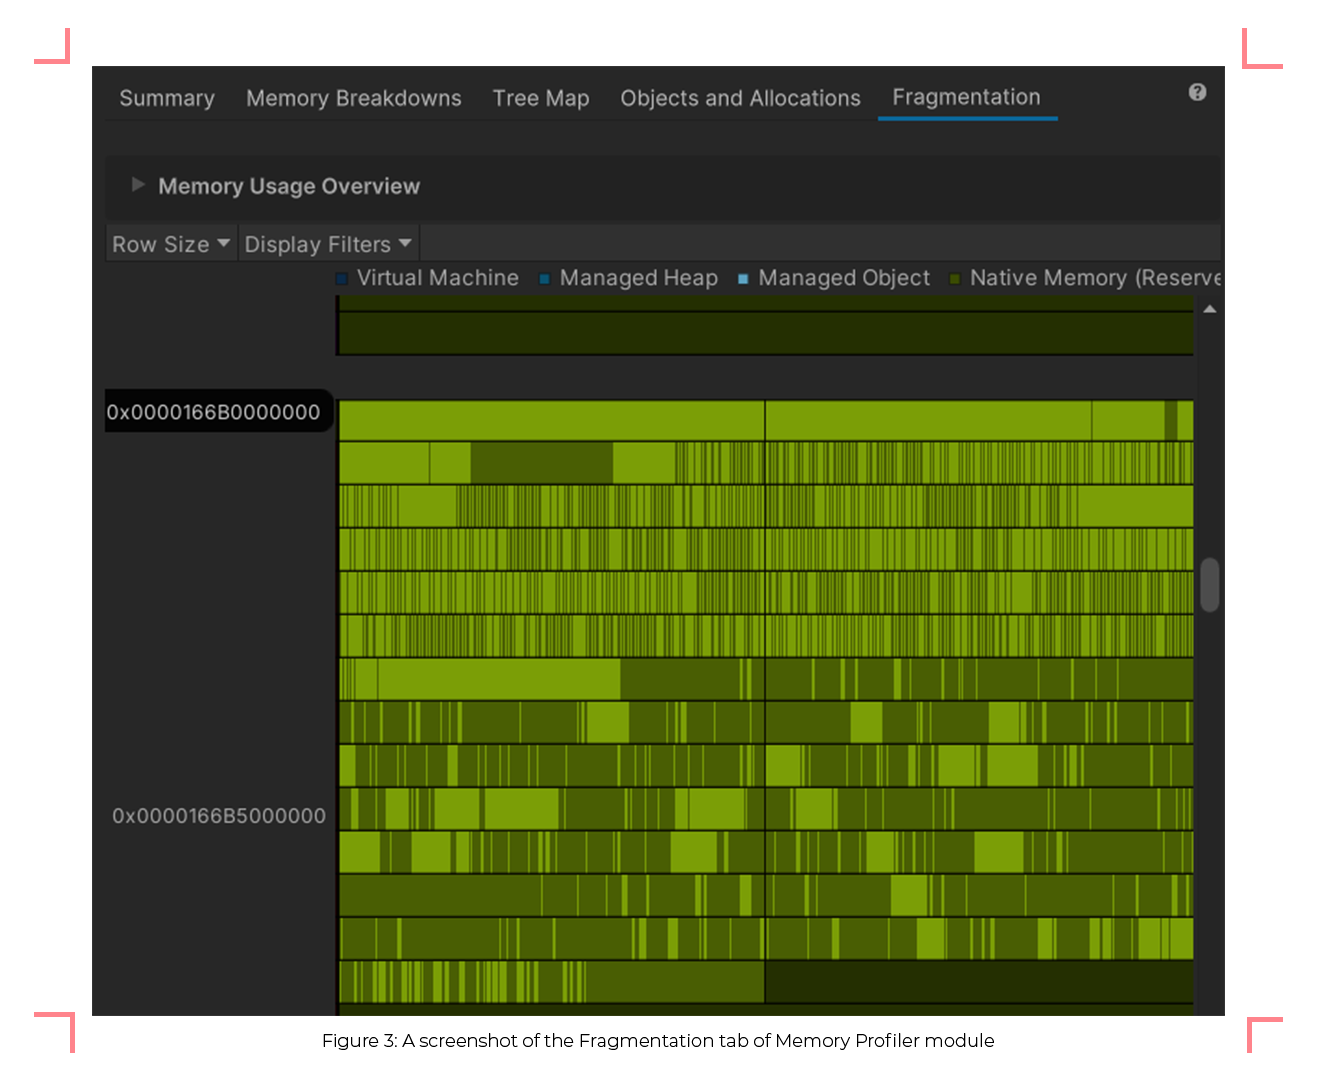
Depending upon the build type and the complexity of a game, fragmentation of memory can eventually lead to an application running out of memory (OOM). Even if an application does not run out of memory, it can cause unnecessary frequent invocations of Garbage collector and/or expansion of heap, which may lead to a degradation in game performance. The memory fragmentation tool lets you inspect how the memory is allocated and to what extent it is being fragmented. You can use this information to further optimize your game by restructuring code that reduces memory fragmentation. For example, reusing collections and arrays instead of creating new collections can reduce memory fragmentation.
Common issues that lead to memory leaks
There are multiple ways in which memory leaks could occur but the following are the most common:
Use of Persistent GameObjects
One of the most common oversights that lead to memory leaks is an improper use of persistent game objects. Often, developers may use a Singleton class or mark a component as DontDestroyOnLoad. While your game architecture may require some classes to persist across scenes, they may also lead to memory leaks. If the objects that are referenced by the persistent classes are not unloaded, then those memory leaks could quickly build up and your game could risk running out of memory. Another scenario that could lead to a memory leak is when user allocated objects or resources are not unloaded or cleaned up after unloading a Scene.
Spawning without proper object management
The most common mistake beginner game developers may make is to use Instantiate an object but then forget to destroy it. Over a period, instantiating objects continuously could lead to the game running out of memory. Likewise, using particle systems that either generate too many particles or spawning particles in an Update loop could lead to performance degradation and risk running out of memory.
Pro Tip: It is worth noting that if you are repeating the cycle of spawning and destroying game objects (or game objects containing particle effects) very frequently, consider using an Object Pooling system to reduce the likelihood of Garbage Collector (GC) being invoked frequently (as it could lead to performance degradation).
Improper use of events
In a VR game real-time simulation game project supervised by the author, the game would progressively slow down after a few in-game days elapse and ultimately lead to the game getting hanged (Application Not Responding/ANR). Initial diagnosis revealed that the application was running out of memory. However, traditional methods of troubleshooting the game failed as the code appeared to check all the right boxes such as using an object pooling system and optimizing textures and other loaded assets. Thereafter, the author suggested that the memory profiler be deployed to snapshot two instances of the in-game days to analyze the memory usage and to check for the source of the issue. It turned out that events were being registered by two different scripts but only one script was unregistering the event, which retained objects in the memory even after the scene was unloaded, thereby leading to OOM.
Keeping memory issues in check with Backtrace
While there are multiple advantages of using the downloadable Memory Profiler Module to troubleshoot and prevent memory issues during the development stage, adding Backtrace to your project further protects your project by allowing you to identify issues that previously went undetected during development and playtest sessions. Backtrace allows you to detect Application Not Responding (ANRs) and Out Of Memory (OOM) exceptions on mobile devices so you can further dig into memory issues by using Backtrace in tandem with the Memory Profiler to find, troubleshoot and resolve memory-related issues before they get out of hand.
Stay tuned for the next blog on how Backtrace can be configured to detect OOM exceptions on mobile builds!
Check out the resources below to learn more about Memory Profiler and how to install it in your next Unity Project.
Try Backtrace today to start detecting errors, memory issues and ANRs before they ruin your customer’s gaming experience.
Backtrace is a Unity VSP (Verified Solution Partner). Learn more about how we work with Unity and sign up for free today:
https://backtrace.io/unity/