Backtrace Blog
For the latest developments from our engineering team, head over to the Engineering Blog at engineering.backtrace.io.
Best Practices to Handle Performance and Out-of-Memory Issues on Mobile Builds in Unity
In this blog, we explore the best practices to reduce memory use and deal with OOM issues on mobile builds in Unity.
In a previous blog, we explored how Unity’s memory profiler can be used to troubleshoot out-of-memory issues and some of the common issues that lead to memory leaks. In this blog, we explore the best practices to reduce memory use and deal with OOM issues on mobile builds in Unity.
Best Practices to reduce memory footprint
Choose the right integral type
Memory can be precious in a data intensive or a large game and even more so if your game runs on a mobile. If your game stores a lot of data, even a small change to the variable type could mean a lot of difference in terms of memory consumption. For example, if you know that a variable such as a player’s score would be consist of a maximum of four digits and would always be a positive value, consider using a ‘ushort’ (which can store values between 0 and 65,535 and consumes just 2 bytes of memory), instead of ‘int’ (which could cost you 4 bytes). While a difference of 2 bytes may not sound a lot, it will certainly make a difference if you store thousands of such values in an array or a list. Check out the documentation here for a table of integral types and the memory consumption for each type.
Shaders
Use of unoptimized or poorly written shaders can not only affect performance but also result in a poor use of memory. Consider using optimized shaders under the URP pipeline. Additionally, you may use shader authoring tools like ShaderGraph or Amplify Shader Editor to customize the look of your materials while keeping the shaders optimized.
LODs
In addition to using baking techniques to bake higher poly details into a lower poly model, you may consider using Level of Detail (LOD) meshes. Consider using LODs to optimize memory usage and frame rate, as a high resolution model would result in a high memory usage. For example, a 3000-triangle character model with a high level of detail may require skin shaders and hair shaders when rendered from a close-up view but the same character when viewed from a far-off distance need not require the same level of detail. By using LODs, this character can be replaced with a simpler model that may use not more than a couple of hundred triangles. By utilizing a simpler material as well, you may reduce memory footprint and optimize performance.
Textures
A large chunk of your memory would likely be occupied by textures. Therefore, it is critical that you spend time optimizing your textures to reduce memory usage.
- Use a smaller texture size where possible
- Use texture compression settings and POT (power-of-two) texture dimensions
- Reduce draw calls by packing multiple textures into a single texture atlas. A number of third party solutions exist to pack multiple textures into a single texture or you may use Unity’s Sprite Atlas system.
Mesh Optimization Caveats
Meshes are batched based on a number of factors, including the shader being utilized, the material and the texture. Unity has the ability to ‘batch’ or combine meshes that share a single material. For static meshes, while this may reduce the number of draw calls and CPU usage, it comes at the cost of added memory usage and therefore must be used carefully.
Addressables and Asset Bundles
Consider using Asset Bundles to move your non-logic assets such as textures, audio files, models and prefabs into a separate downloadable content. You can use Unity’s Addressables system to manage the downloadable content and asynchronously download the asset bundles on demand. Learn more about Addressables System here.
Other techniques
- You may use Occlusion Culling to remove objects that are not visible in a camera view.
- Lightmaps and Light probes can be used to bake realistic lighting and shadows and greatly improve performance and the look of the game.
- Use fake shadows instead of dynamic shadows where possible. There are assets in Unity Asset Store that can ‘fake’ shadows using a very low draw count
- Minimize use of alpha textures
- Reduce the use of post-processing effects where possible, as they may significantly affect performance.
Using Backtrace to detect out-of-memory issues
Backtrace allows developers to integrate crash handling into their apps, capture and monitor errors, prioritize issues to work on, and get everything they need to debug the problem in a single interface.
While the techniques mentioned in our blogs will help you to design better apps and games that reduce the likelihood of running out of memory, there can be undetected issues that might still result in your app running out of memory. In those situations, Backtrace makes it easy for Unity mobile developers to report out-of-memory exceptions automatically.
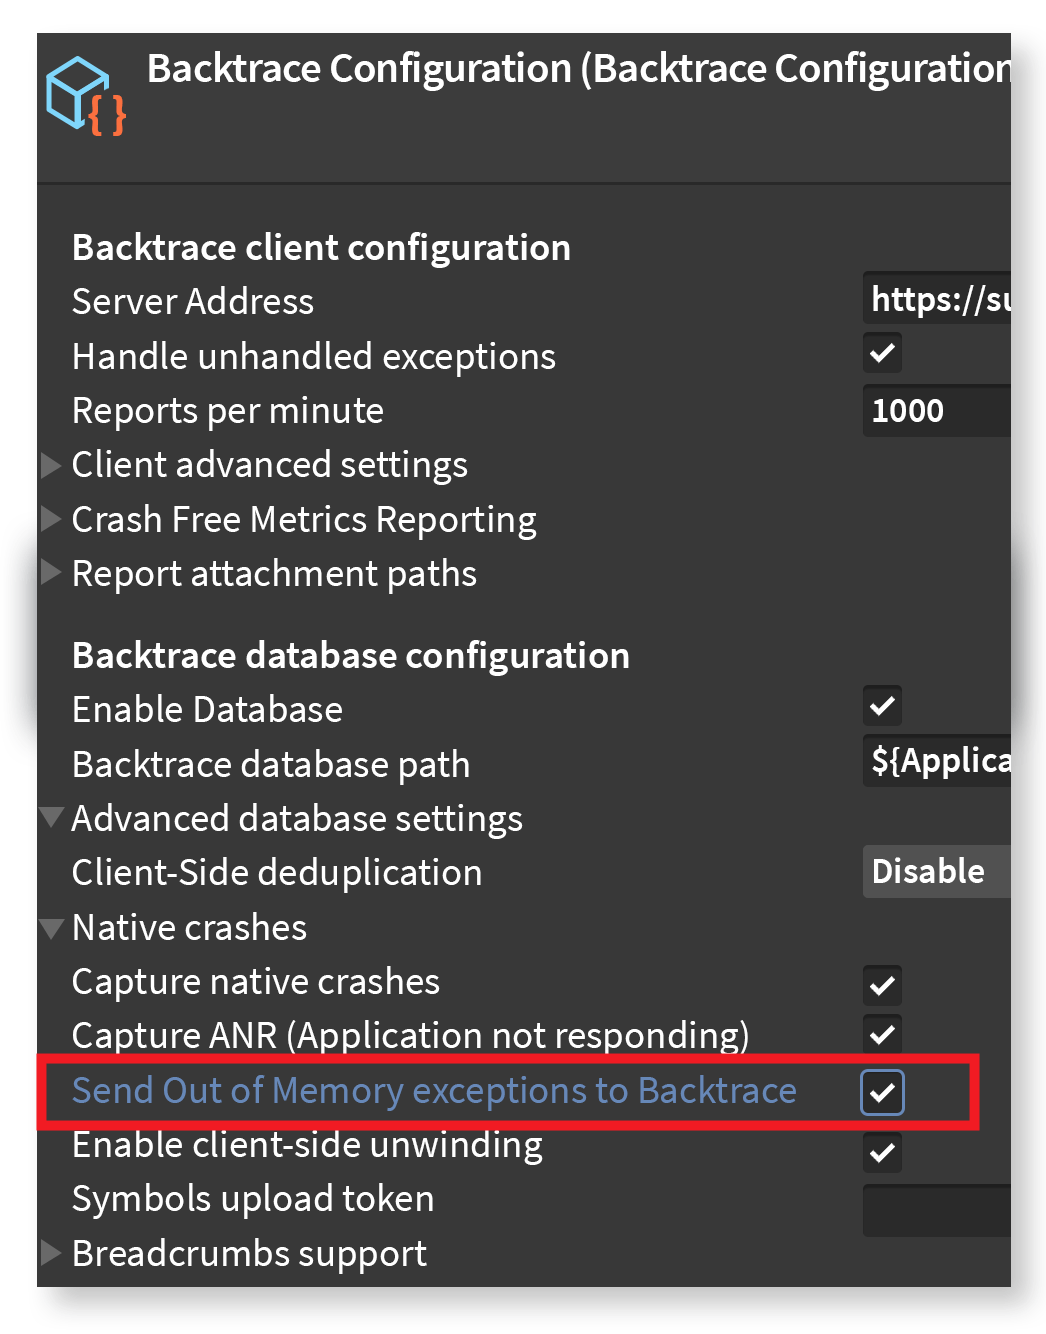
To start reporting out-of-memory exceptions, all you have to do is to check ‘Send Out of Memory Exceptions to Backtrace’ in the Backtrace configuration.
Steps to enable Out of Memory Exceptions in Unity
- Select the Backtrace Configuration asset file in the project window
- Expand the ‘Advanced database settings’ foldoutTip: If you do not have the database enabled, you won’t see the ‘Advanced database settings foldout’. Ensure that the ‘Enable database’ is checked
- Expand the ‘Native crashes’ foldout
- Check ‘Send Out of Memory exceptions to Backtrace’

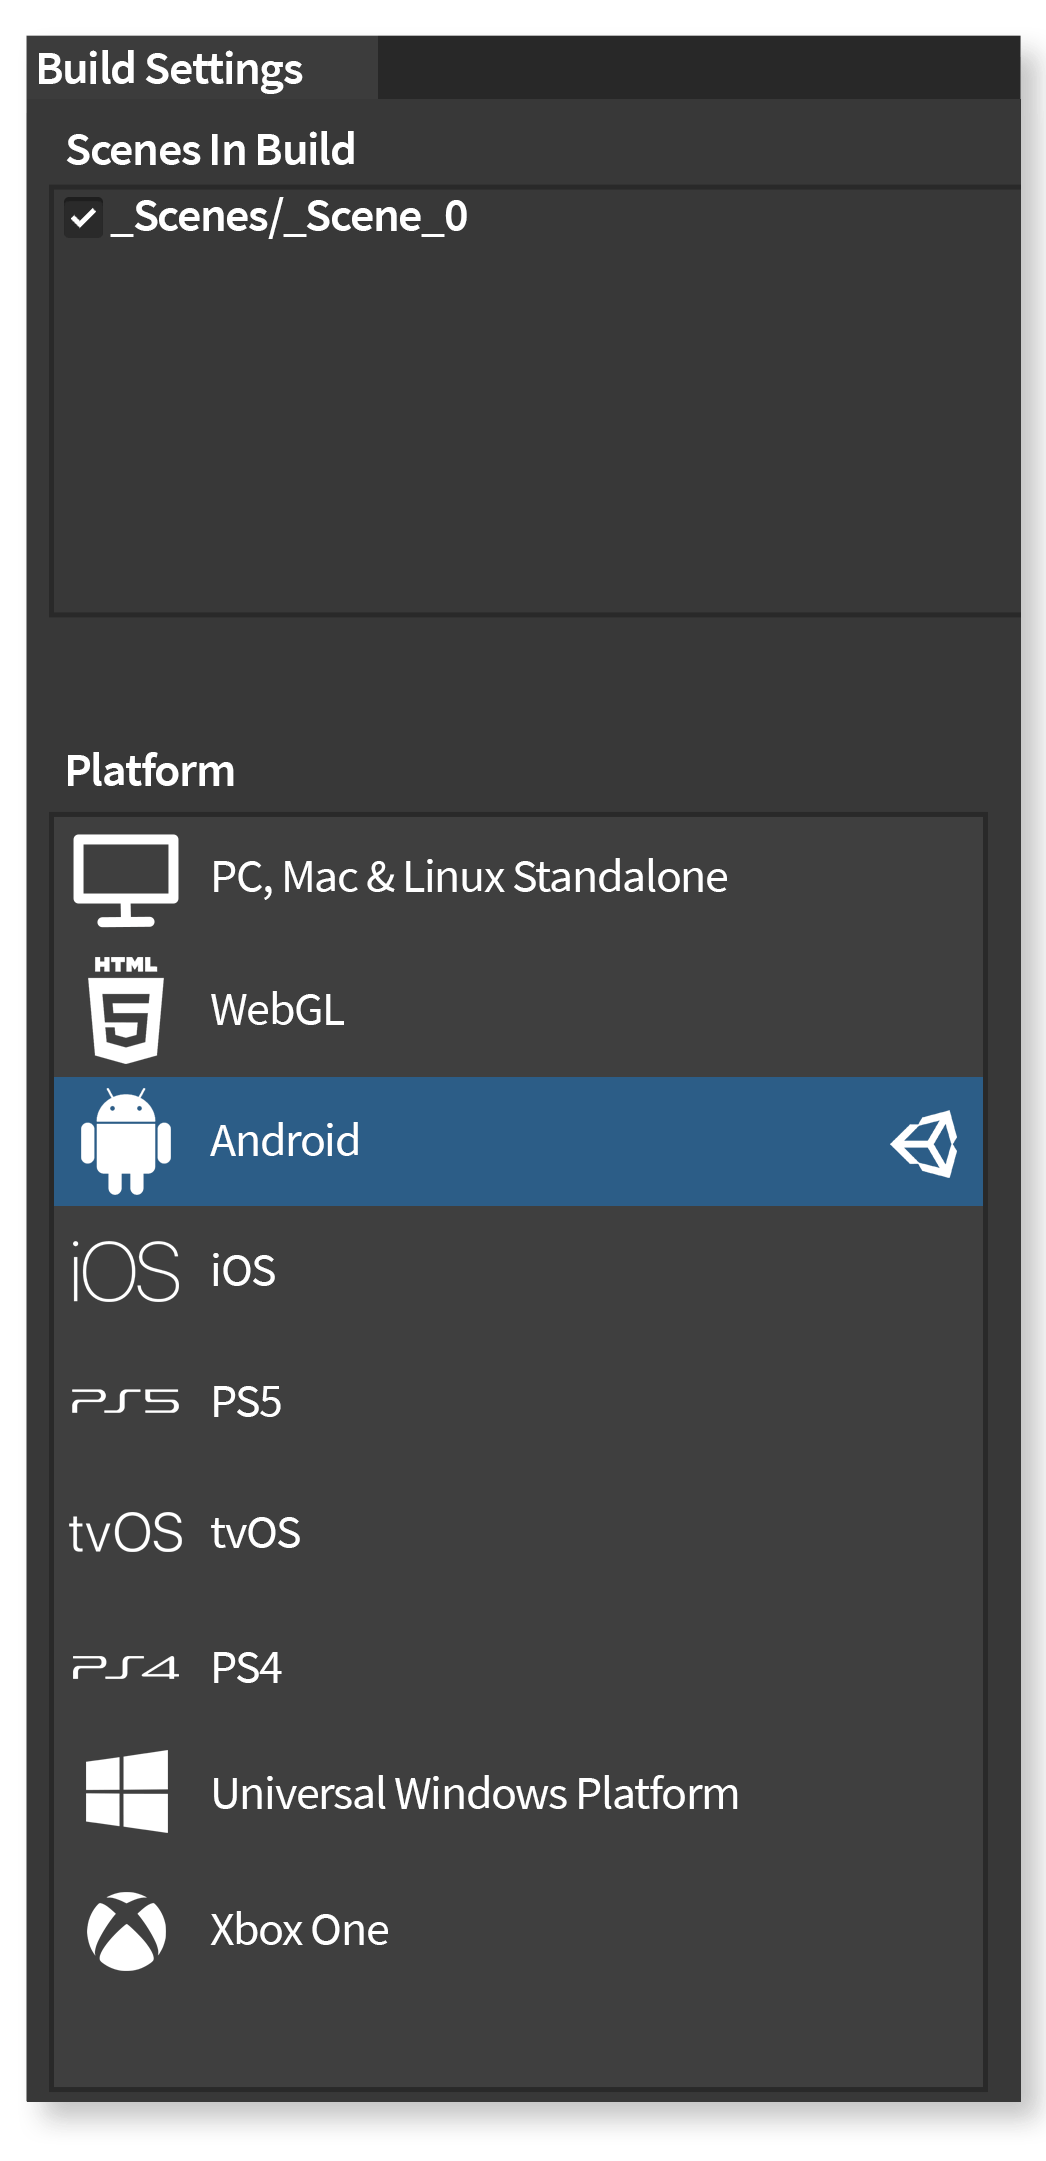
Tip: Native Crashes foldout won’t be available on platforms other than mobile (Android or iOS). If the foldout is not visible, ensure that your project is currently in either Android or iOS platform under Build Settings.

Backtrace is a Unity VSP (Verified Solution Partner).
Learn more about how we work with Unity and sign up for free today:
