
Backtrace Blog
For the latest developments from our engineering team, head over to the Engineering Blog at engineering.backtrace.io.
Capture And Analyze Native IOS Crashes With Backtrace-Unity 3.2
The backtrace-unity 3.2 release adds new capabilities to support iOS games. Mobile game programmers can now effortlessly capture native iOS crashes for the Unity engine or 3rd party plugins.
Capture And Analyze Native IOS Crashes With Backtrace-Unity 3.2
The backtrace-unity 3.2 release adds new capabilities to support iOS games. Mobile game programmers can now effortlessly capture native iOS crashes for the Unity engine or 3rd party plugins. The capture library also collects native memory and process statistics to provide deeper insight than other error reporting solutions. In addition, programmers can now quickly filter any error by the new type attribute, which has values for Crash, Hang, Exception, Unhandled Exception, or Message.
NATIVE CRASH CAPTURE FOR IOS
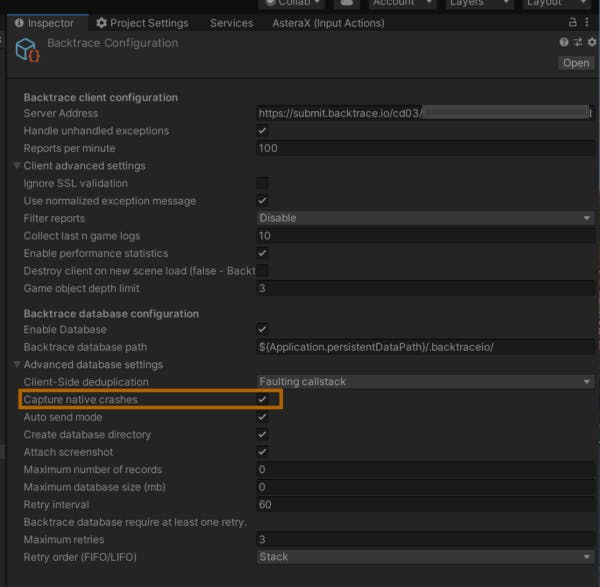
After enabling backtrace-unity for your game, you can use the Backtrace Configuration Panel in the Unity Editor to toggle Native crash reporting.
The “Capture native crashes” option will ensure that the backtrace-unity plugin will capture and submit a .plcrash formatted error after an iOS crash from the Unity engine or any other private or 3rd party plugins. Submission occurs upon restart of the game.
VIEWING AN IOS CRASH
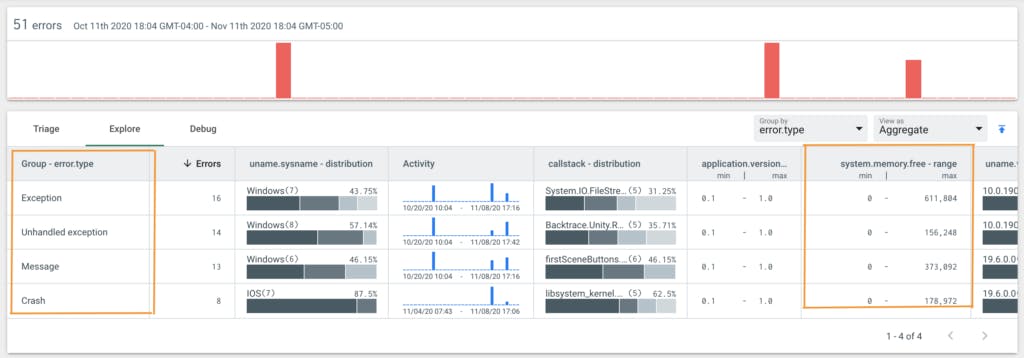
iOS crashes will be identifiable in Backtrace with a uname.sysname of IOS and an error.type of Crash. (Note: error.type is a new Attribute that you may need to index under Project Settings/Attributes after receiving a new crash). Programers can use Backtrace’s Debugger to view the iOS crash, including a list of the threads running within the process at the time of crash, human readable call stacks for each frame where symbols were made available, system and custom metadata, and more.
Backtrace also captures native iOS memory and process information, including process.age (how long the game was running), and system.memory.free, total, and used to see how much memory was available AND consumed.
TRY IT TODAY!
Backtrace is a Unity VSP (Verified Solution Partner). You can learn more about how we work with Unity and start a free trial at https://unity.com/products/backtrace