
Backtrace Blog
For the latest developments from our engineering team, head over to the Engineering Blog at engineering.backtrace.io.
Capture And Analyze NDK Crashes With Backtrace-Unity 3.1
The backtrace-unity plugin helps game studios fix bugs and errors in their games faster than they could before. With the new backtrace-unity 3.1 release, studios can now collect and analyze those types of crashes to help you more quickly mitigate and resolve them.
Capture And Analyze NDK Crashes With Backtrace-Unity 3.1
The backtrace-unity plugin helps game studios fix bugs and errors in their games faster than they could before.
With the new backtrace-unity 3.1 release, studios can now collect and analyze Android NDK crashes for mobile games. NDK crashes can occur when the game engine or a 3rd party plugin faults due to misuse or buggy code. With a few configuration options, you can now use Backtrace to capture and analyze those types of crashes to help you more quickly mitigate and resolve them.
CONFIGURATION OPTIONS FOR ANDROID
After enabling backtrace-unity for your game, you can use the Backtrace Configuration Panel in the Unity Editor to setup a variety of options. The Panel will only show you options relevant to the platform you are deploying your game too.
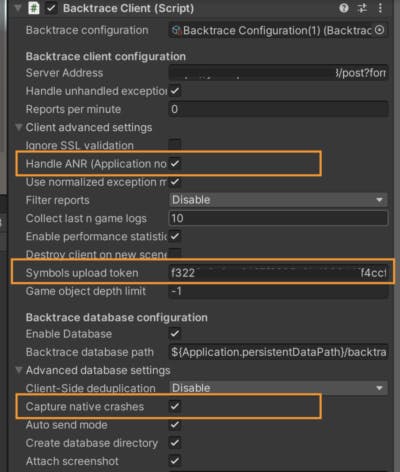
If you are building your Unity game for Android, you will see new options to “Capture native crashes” and “Symbols upload token” in the Backtrace Configuration UI. Note from previous releases the option to “Handle ANRs” to capture hangs as well.
- “Capture native crashes” will ensure that the backtrace-unity plugin will capture and submit a minidumps after an NDK crash from the engine or any other private or 3rd party plugins.
- “Symbols upload token” will be used to offer you the option to upload (or skip) the required symbols files from your local machine during the build process. If you have a custom build process, the Backtrace support team can help provide your team with instructions on what to submit.
- “Handle ANR” will capture details when the application stops responded for a set period of time. Backtrace uses Androids’s ANR error trigger to determine that this event has occurred.
VIEWING AN NDK CRASH
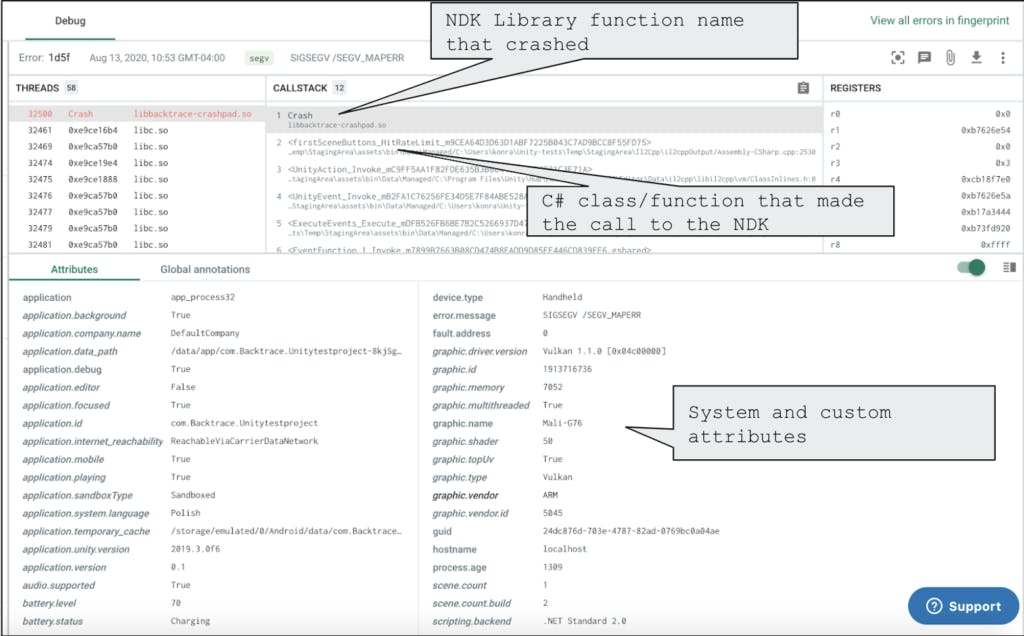
NDK crashes will be identifiable in Backtrace with a classifier such as SEGV or similar cause to the crash. Engineers will use Backtrace’s Debugger to view the NDK crash, including a list of the threads running within the process at the time of crash, human readable call stacks for each frame where symbols were made available, system and custom metadata, and more.
In the screenshot below, you can see the engineer viewing the faulting thread and the details of the call stack for that thread. The call stack shows the name of the NDK function and library that crashed, and the C# class or function that made the call to the NDK. This should be the right amount of information for an engineer to further deduce if they are passing incorrect information into the NDK library, or if the library itself is buggy. The minidump file is even available for download and further analysis in Android Studio or other debugging tools as needed.
TRY IT TODAY!
Backtrace is a Unity VSP (Verified Solution Partner). You can learn more about how we work with Unity and start a free trial at https://unity.com/products/backtrace